


 295 / 311

[
] 296
developed the original software to detect the suspected
logging areas routinely and smoothly. Functions of
the software include making multi-temporal colour
composite images, cutting out certain areas from the
colour composite image, and extracting those areas as
GeoTIFF or KML formats.
Estimating forest biomass in Indonesia
Since the 1990s, Indonesia has used optical satellite data
(Landsat) for forest monitoring, but cloud cover has been
information. If large areas are deforested during the period between
the two sets of observation data, the colour composite image would
show an area of deforestation as darker than a normal forest area.
Furthermore, new deforestation areas are shown as a dark reddish
colour, while old deforestation areas are shown as dark brown.
In other words, illegal logging is probably under way in the areas
shown as dark reddish in the colour composite image.
The colour composite image was divided into several scenes
and delivered to interpreters of IBAMA and DPF in order to
detect the dark reddish suspected logging areas. There are several
interpreters to check the colour composite images covering the
whole area of Brazilian Amazon forest. The divided scenes can be
extracted as GeoTIFF or KML format so that the interpreters can
easily overlay the images on the other optical satellite images on
their GIS or even using Google Earth. Needless to say, GIS helps
the interpreters identify the position of suspected logging areas.
When the interpreters find such areas, the DPF officials rush to the
area to prevent further illegal logging and protect the forest. The
rapid delivery, process and analysis of PALSAR data is the key to
preventing illegal logging. This has only been made possible with
ScanSAR data because it can cover the whole of Brazil within five
or six days. While ground resolution of ScanSAR data is only 100
m, speed of delivery and the extent of coverage are more important
for this project.
To complete the project, RESTEC transferred the required analysis
techniques through training. As radar satellite data is very different
from optical data, RESTEC started the first training with very basic
radar theory and handling techniques. Then, more advanced tech-
niques such as change detection, multi-temporal composite, visual
interpretation and so on were transferred. In parallel, RESTEC
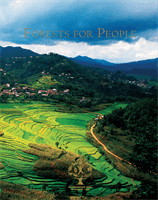
Colour composite image
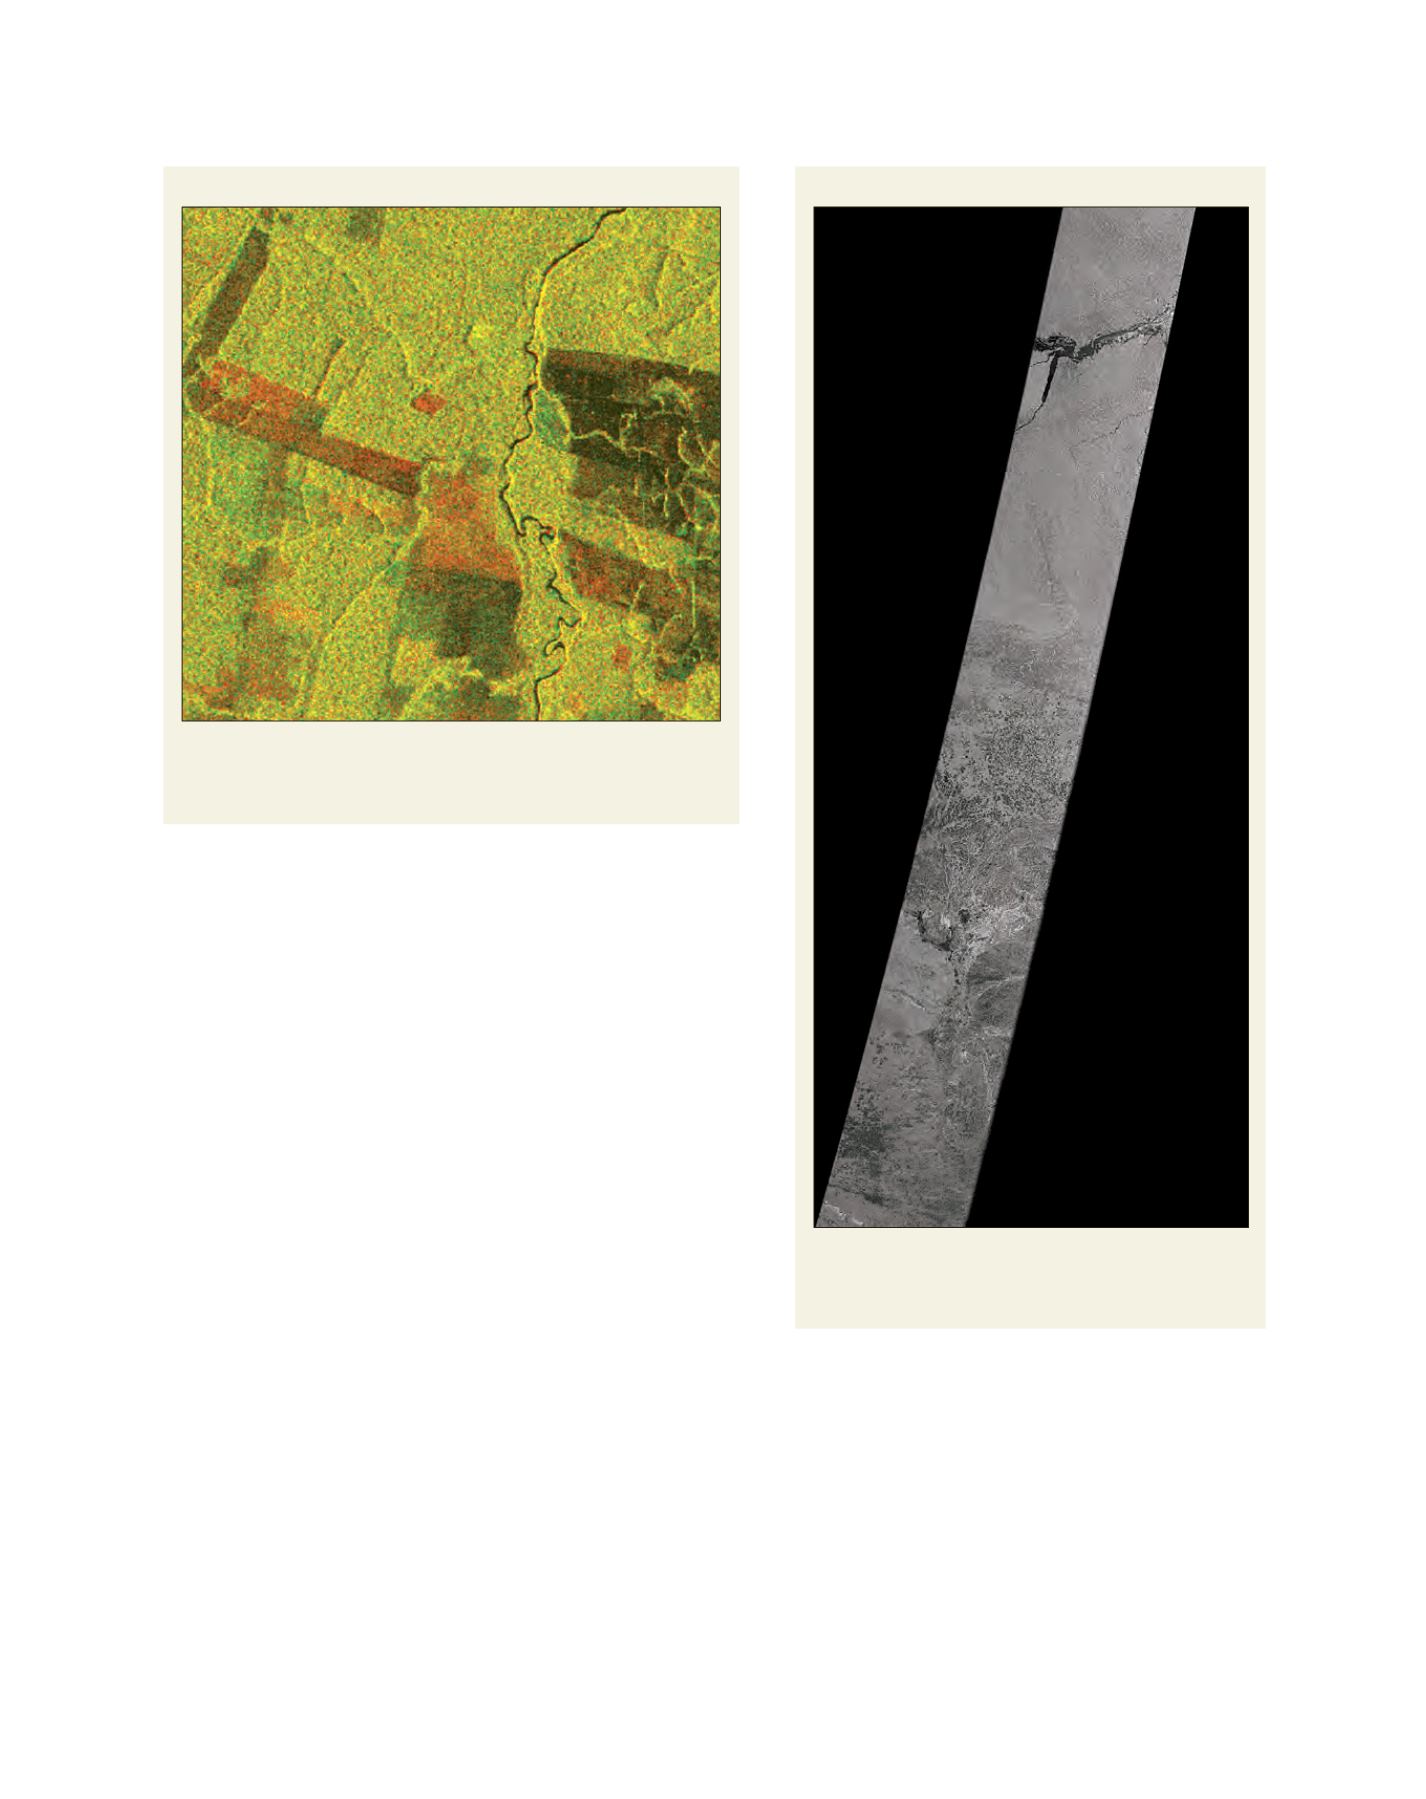
PALSAR ScanSAR strip data
Colour composite images can be made from multi-temporal strip data. New
deforestation areas are visible as a reddish dark colour and old deforestation
areas are dark brown
The original PALSAR ScanSAR strip data is a black and white
image, with a single strip covering an area 350 km wide and
3,000 km long
Source: ©RESTEC included ©JAXA, METI
Source: ©JAXA, METI