


 75 / 258

[
] 73
million in 2010/11 due to the division of farm families. The average
size of land holdings decreased from1.55 hectares to 1.16 hectares
during the same period. Out of 137.7 million total operational
holdings, 117.1 million holdings (84.98 per cent) are operated
by marginal and small farmers who have an area of less than 2
hectares. In some states like Bihar, Orissa, marginal and small
holdings are highly scattered, putting a question mark over their
sustainability. Small andmarginal holdings were 78.28 per cent in
1990/91 when they were operating 32.46 per cent of the total area.
Operational holdings of 2-10 hectares constitute about 14.3
per cent of the total holdings with 44.76 per cent of the total
operated area, and the large holdings (10 hectares and above)
constitute 0.73 per cent of the total number of holdings with a
share of 10.92 per cent of the total operated area. Thus, it can be
seen that 85 per cent of the farmers cultivate about 44 per cent of
the operated area and 15 per cent of farmers cultivate 56 per cent
of it. Although small and marginal farmers have higher produc-
tivity from small holdings compared to large holdings, they also
have low marketable surplus and profit. Estimates indicate that
small and marginal farmers may account for more than 91 per
cent of farm holdings by 2030. The sustainability of decreas-
ing farm sizes in the long run will be a great cause for concern.
According to a Planning Commission report, about 10 per cent of
rural households are reported to be entirely landless, and a large
percentage to be near landless. With little or no owned land they
depend on informal leasing arrangements.
2
Various studies in India during the 1960s, 1970s and in later
years have revealed that there is an inverse relationship between
the size of a farm and productivity, despite a few researchers
holding a contrary opinion.
3
These family farms, consisting
of marginal and small farms, are a typical example of a diver-
sified farming system involved in crop production, within
which farmers grow more crops alongside animal husbandry to
become independent. According to one study
4
more than 60 per
cent of farm produce comes from small farms only. Marginal
farmers have been major contributors to the production of key
staple commodities. In 2000/01, marginal farmers produced 32
per cent of India’s rice, 24 per cent of its wheat, 23 per cent of
sugarcane, 14 per cent of pulses, and 13 per cent of oilseeds.
The smallholders and landless farmers together also
control about 71 per cent of cattle, 63 per cent of buffa-
loes, 66 per cent of small ruminants (goats and sheep),
70 per cent of pigs and 74 per cent of poultry.
5
Small and
marginal farmers actually engage in cropping patterns that
give them higher average revenues (high-value crops and
cropping intensity) per hectare than for large farmers who
focus mainly on lower-end staple crops.
6
Marginal farmers
with under 0.4 hectares realize the highest output values per
hectare (Rs25,000) and large-scale farmers have the lowest
earnings (Rs7,700). The value of output per hectare and
net income per hectare of cropped areas is greater for small
farms than for medium and large farms. Similarly, the cost of
cultivation per hectare of smallholdings is also greater than
medium and large holdings.
Research has found that per capita output is low on
smallholdings despite higher productivity, due to lower
per capita availability of land.
7
Therefore, a tiny piece of
land cannot generate enough income to take care of the
livelihood needs of a small farm family. According to
Tendulakar Committee norms, the family dependent on
agricultural income needs a minimum 0.8 hectares of land
to keep a farm family above the poverty line. Therefore 75
per cent of smallholders cannot meet their livelihood from
farm income alone. In addition, poverty for smallholding
farmers is much higher than for other farmers.
8
There is a
need to increase the productivity and income of smallhold-
ings to promote non-farm employment opportunities for
these farmers.
Government of India initiatives
Several new initiatives have been taken in the recent past by the
Government to support the agricultural sector in general, and
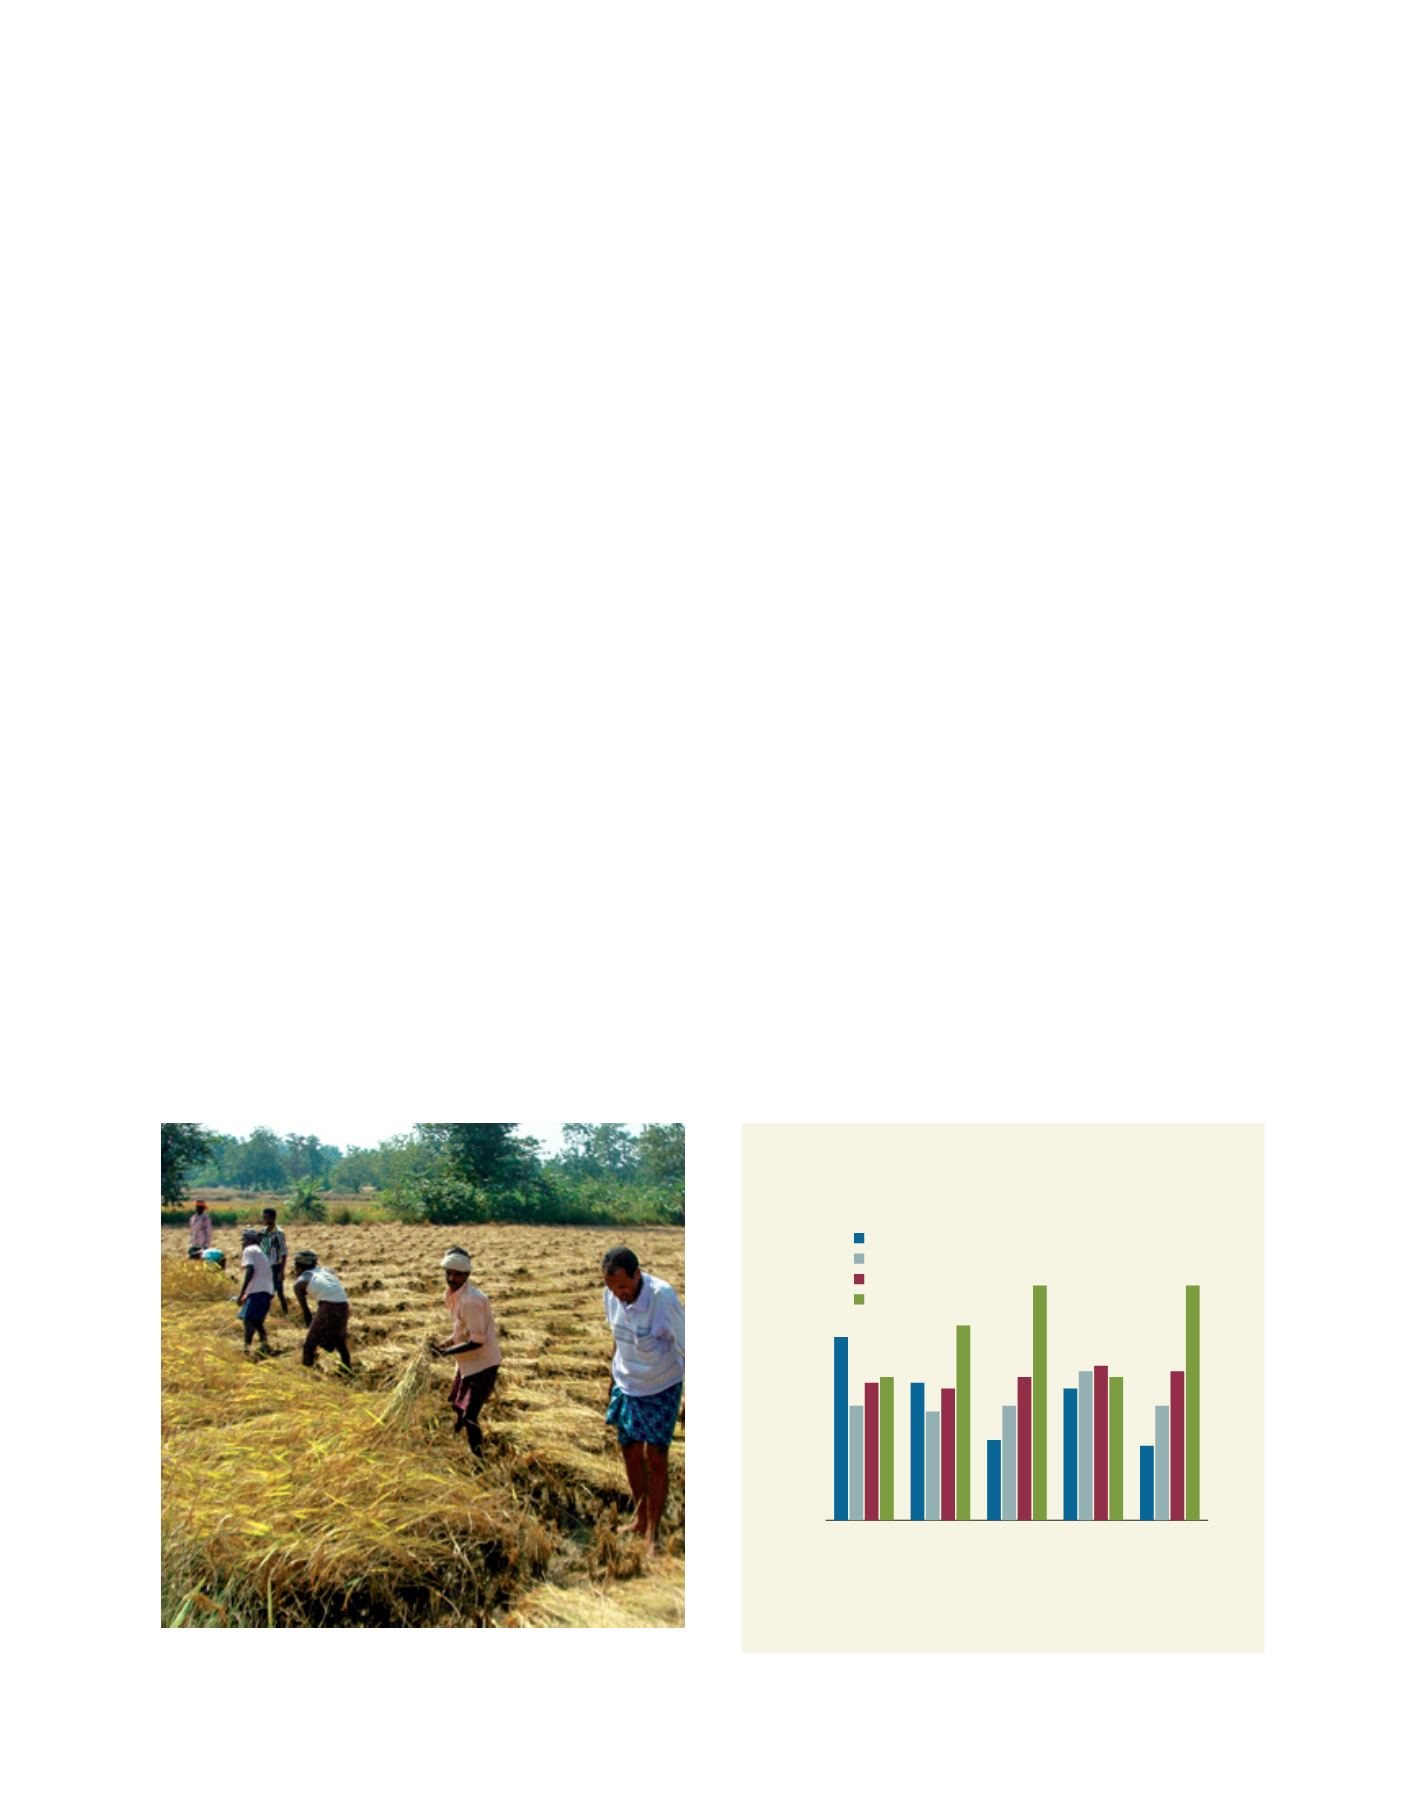
The majority of India’s population depends on agriculture for its livelihood
Image: Dept. of Agriculture, Govt. of Odisha, India
Share of the output value of major crops
by farmer category
Source: Agricultural Census 2001/02
0
10
20
30
40
50
Medium farmers
Large farmers
Small farmers
Marginal farmers
Rice Wheat
Pulses Sugarcane Oilseeds
Crop
Per cent share
D
eep
R
oots