


 203 / 280

[
] 203
ment of the variability of coastal wind resources can be
readily achieved from space by combining global data
from Scatterometers at O(25km) resolution and
regional data from Synthetic Aperture Radar (SAR) at
O(100m) resolution. Radar data from SAR can also
be used to study the shadow effect of mountains and
the wake created by large turbines, which may reach
more than 20 km downstream of offshore wind farms.
2
Optimizing design for maintenance operations
Assessing the operability and availability of offshore wind
turbines, including the effects of support logistics and the
numbers and capabilities of maintenance vessels, is a key
part of studying the feasibility of wind farm projects. An
important question arising at the earlier stages of devel-
opment is whether it is more cost effective to spend
money on incremental improvements on turbine relia-
bility, or to buy more maintenance vessels.
EO can help address this question by quantifying the
site-specific met-ocean conditions through long-term
data sets of wind and wave conditions.
3
Such statistical
information can be used in a variety of applications,
including the determination of the type of vessels
needed for maintenance, the quantification of fatigue
load of an offshore wind turbine, and the optimal design
and assessment of ‘downtime’ for turbines.
4
Assessing environmental conditions
Wind farms can raise environmental problems such as
the level of noise, visual effect, impact on bird popula-
tions and marine biological activity. In order to assess
the potential environmental impact of planned wind
farms, an acoustic wave and current meter instrument
can be deployed at the site to measure the sediment load.
However, operating in-situ sensors in harsh marine
conditions is challenging and can lead to massive bio-
fouling due to the presence of whelks and eggs covering
the sensor after recovery.
In contrast, monitoring from space suffers from no
such problem and can deliver a synoptic map of sedi-
ment matter. This combines well with the in-situ data
and complements them by providing additional infor-
mation on the spatial distribution of sediments.
The outlook for Earth observation wind data
EO satellites orbiting hundreds of kilometres above the
Earth can help the industry to better harness the power
of wind. EO data provide wind investors and engineers
with wide-area observation that is unavailable any other
way. This data enables them to conduct a first check of
multiple prospective sites (even those inaccessible or
remote) without leaving their office, and at a much
cheaper cost than travelling to the site.
EO is however, only one part of the solution and needs
to be integrated with other ancillary data into wider
knowledge solutions to open new business opportuni-
ties. Realizing the full potential of EO in this context
requires further close collaboration between users and
providers of the technology.
cient and economic operation of the power system when integrating
substantial amounts of wind power.
Satellites can help to improve the accuracy of models by provid-
ing data on weather conditions and boundary conditions, both
onshore (eg orography, surface roughness) and offshore (eg sea
surface temperature), necessary to constrain models. The geospatial
nature of EO data is particularly suited to initialize, validate and force
models as they capture the heterogeneities of factors influencing the
wind flow. For example, satellites can measure the variations in sea
surface temperature, which are responsible for a systematic devia-
tion of the vertical wind speed profile from the standard
Monin-Obukhov theory (typically found for near neutral and stable
conditions).
Synoptic mapping of ocean wind resources
The traditional way to assess the potential energy yield of a prospec-
tive wind farm is by using data from a meteorological mast, which
is very expensive in terms of installation and maintenance. For
example, it can cost around 750, 000EUR for one offshore mast
running for one year. Although this approach is accurate, it can only
provide point-measurement data for a short period of time (typically
one year), while the wind field is generally highly variable in space
and time. Using local data can therefore be an issue to assess effec-
tively the ‘bankability’ of prospective wind farms.
In contrast, satellite measurements of ocean winds provide a
more comprehensive and spatially resolved view of wind clima-
tology data and its associated probability distribution. Satellites
are capable of taking measurements within a few m/s for the wind
speed and approximately 20 deg for the wind direction.
1
An assess-
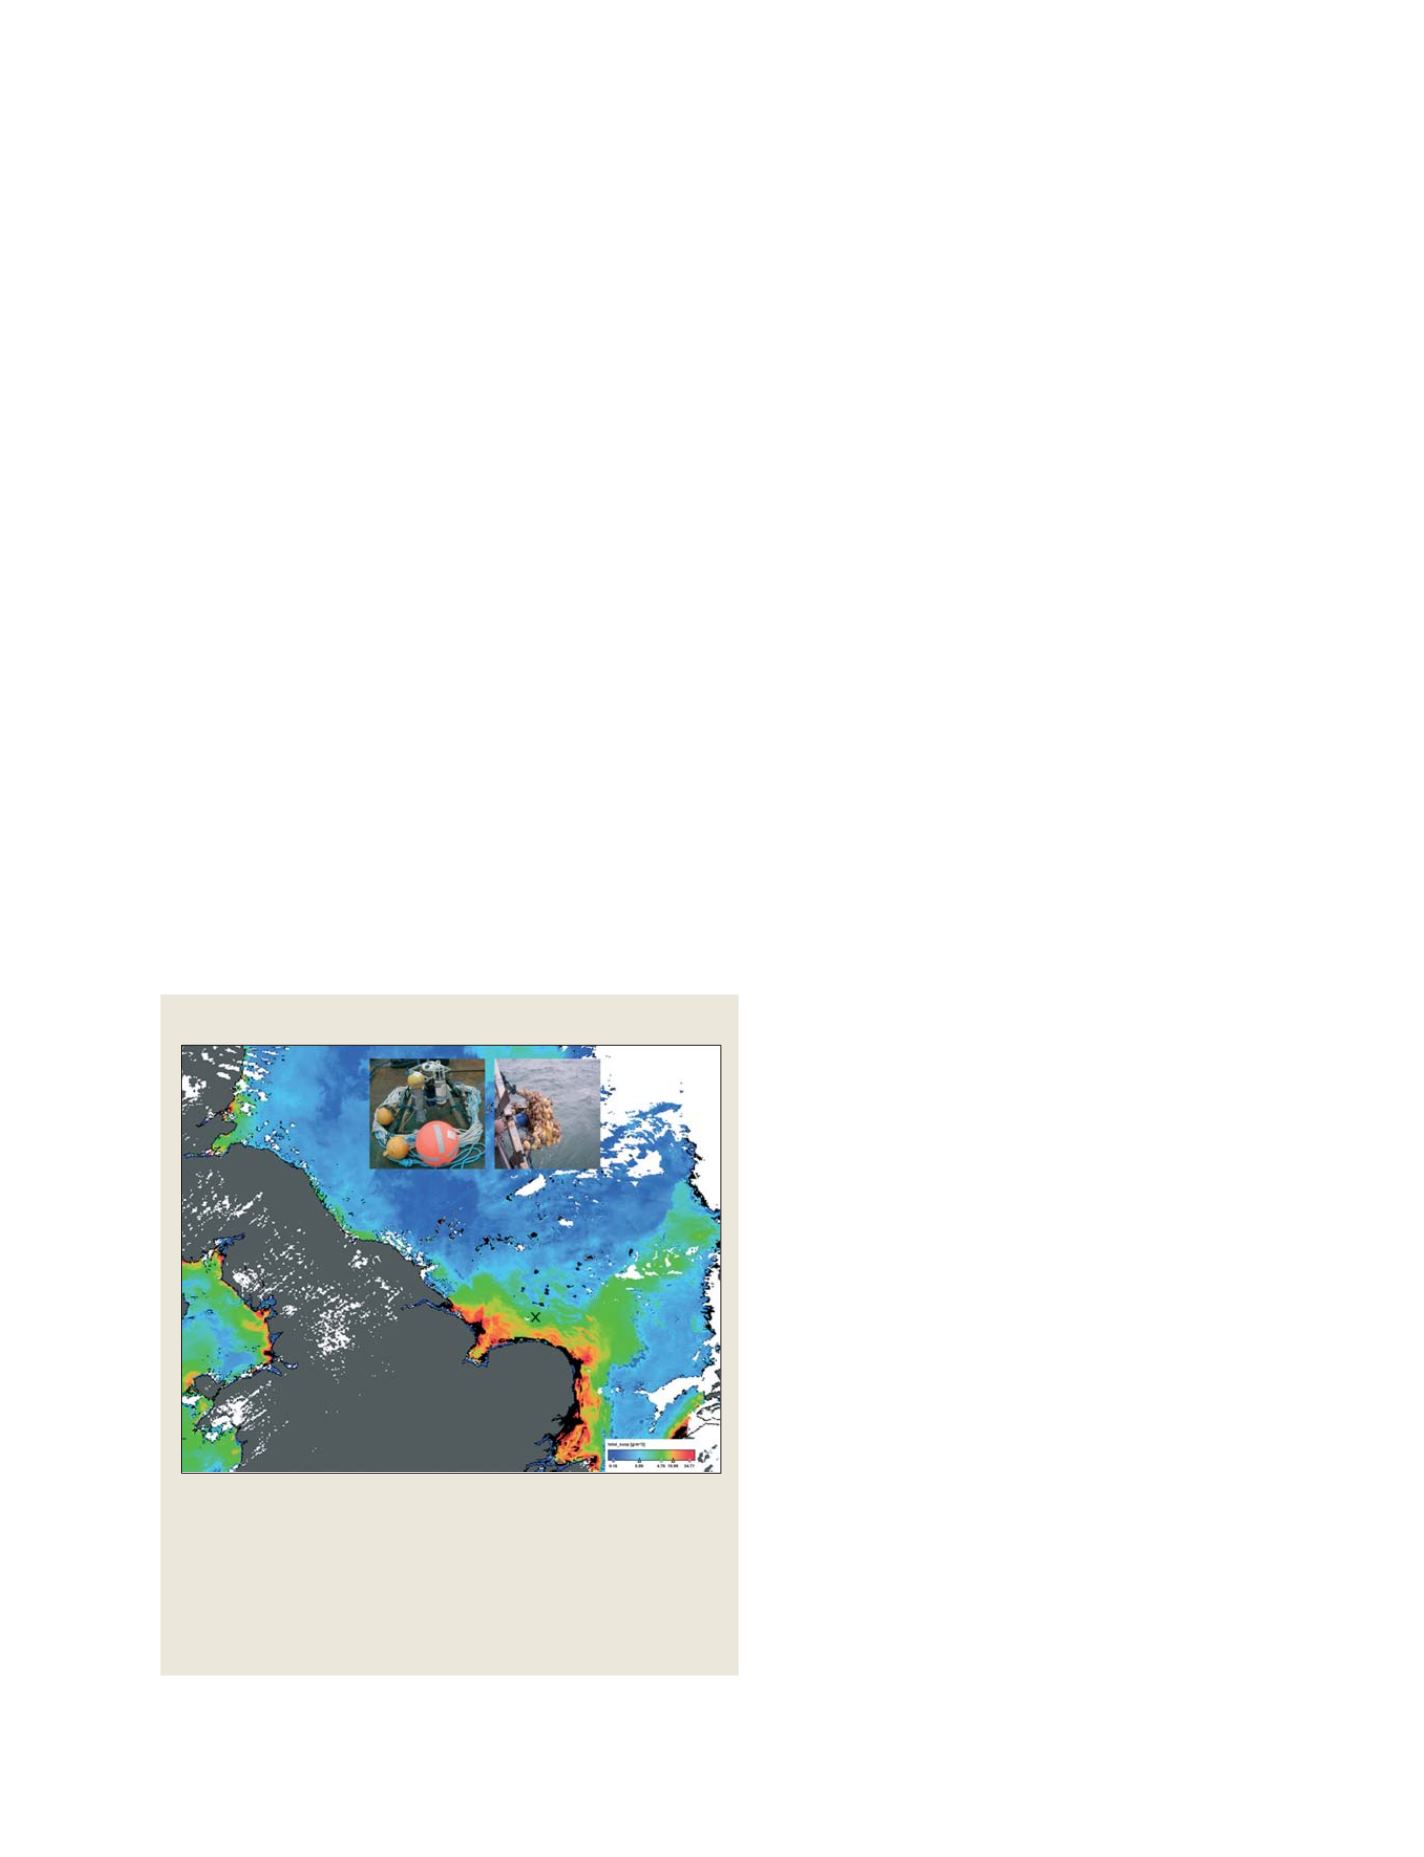
Sediment load measured from space and coastal observatories
Map of total suspended matter derived from the optical instrument MERIS on
board ENVISAT for the 29 April 2005. The colour legend displays increasing
sediment concentration going from blue to green to red. The optical instrument
cannot see through clouds, which are represented in white. The location of the
planned Sheringham Shoal offshore wind farm is marked with a cross. The
acoustic wave and current meter sensor used to measure sediment load via
acoustic backscatter intensities is also represented before and after recovery.
In the upper right image the unit is covered by whelks and whelks’ eggs
Source: GRAS, SCIRA Offshore Energy Ltd and Gardline Environmental Ltd
S
OCIETAL
B
ENEFIT
A
REAS
– E
NERGY