


 170 / 288

[
] 171
E
nergy
quently skews the abatement opportunities available to
an organisation. A robust approach to carbon manage-
ment typically requires methodical carbon foot-printing,
identification of efficiency opportunities, development of
carbon management plans, implementation of opportuni-
ties, monitoring and reporting progress. These processes
lay beyond the capability of many businesses and the
opportunities therefore often go uncaptured.
The complexity of these tasks highlights the impor-
tance of the Low Carbon Growth Plan as a decision
making framework. For businesses, it can highlight key
areas of opportunity relevant to their sector including
indicative costs and potential financial returns to inform
investment decisions. The diagram over page demon-
strates how the Plan could assist a chemicals company
capture new low carbon growth opportunities. For policy
makers, the Low Carbon Growth Plan provides a clear
understanding of where to direct policy to best enable
businesses to identify and implement emissions reduc-
tion opportunities.
The Plan is unique as each of these 62 opportunities are quantified
and ranked by their relative merit order. These ‘best bang for buck’
opportunities are presented in an emissions reduction cost curve (see
diagram above).
The opportunities focus on current technology or best practice
and emerging technologies expected to be commercially viable by
2020. This is important, as the Plan highlights readily implementable
actions that don’t require technology breakthrough or changes to the
business mix of our economy.
Consequently, the Plan has emerged as a critical tool for business
and government by establishing a clear vision and roadmap to a low
carbon economy. This technically robust and accessible Plan has
helped to bridge the gap between research and action, helping to build
momentum in the business community and identify cost-effective first
steps in the transition to a low carbon future.
What climate services does the Plan offer?
Effective carbon management remains a key challenge for Australian
businesses. Compared with other countries, Australia’s coal-dominated
electricity supply is particularly emissions intensive, which conse-
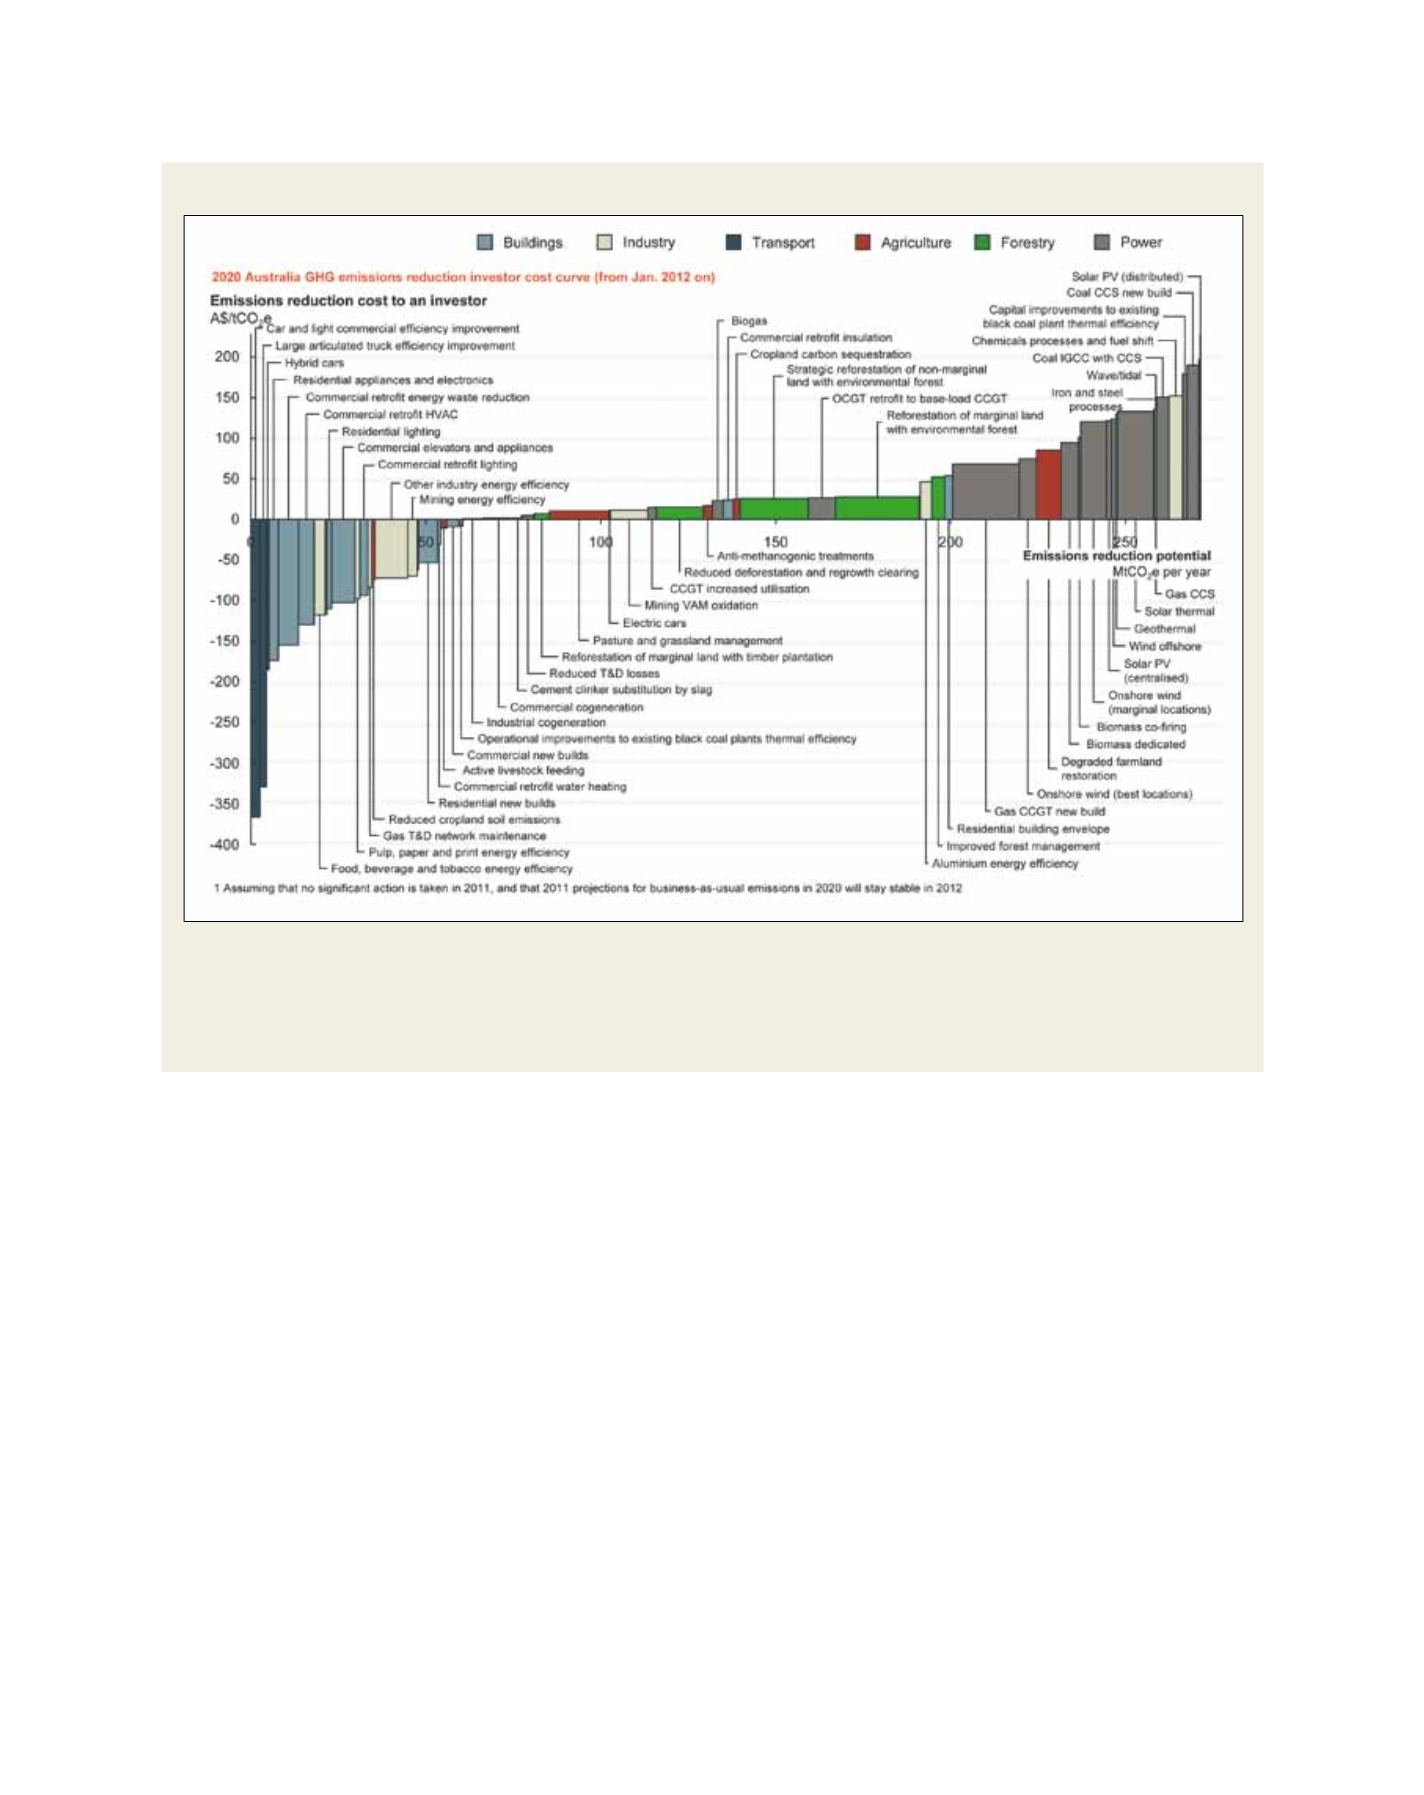
2020 greenhouse gas emissions reduction investor cost curve (from Jan 2012 on) for Australia
Source: ClimateWorks
How to read an emissions reduction cost curve: Each box on the cost curve represents a different abatement opportunity. The width of each box
represents how many tonnes of emissions can be reduced if there is reasonable uptake of the opportunity across the economy. Added up, the width
of all boxes on the cost curve represents the total volume of abatement potential that can be achieved by 2020. The height represents the average
cost of abating one tonne of CO
2
e (carbon dioxide equivalent) in 2020 by implementing that opportunity. Opportunities that fall below the horizontal
axis offer financial savings to businesses and households - even after factoring in the costs associated with capturing that opportunity