


 179 / 287

[
] 180
O
bserving
, P
redicting
and
P
rOjecting
c
limate
c
OnditiOns
of the annual amplitude during the past two and a half
centuries. As the majority of natural proxies used for the
estimation of indirect climate reconstruction provide more
summer than winter information, such proxies tend to
have a summer bias and should not be regarded as being
representative for annual trends – at least in the Alps. A
good example is the coincidence of mild winters and cool
summers in the 1910s that produced remarkable glacier
advances – advances that cannot be explained through the
annual temperature means.
The high spatial homogeneity of temperature trends
does not exist for precipitation. For the two principal
sub-regions – northwest at the windward side of the
Alps towards the prevailing western winds and southeast
at the leeward side – we have observed opposite centen-
nial trends. The northwest has seen a long-term increase
of approximately 10 per cent in the last 150 years, while
the southeast has seen a 10 per cent decrease in the same
period. Only the first part of the 19th century saw a paral-
lel decreasing trend in both sub-regions. This dipole-like
structure corresponds to the same pattern expected for
the 21st century by most of the regional European climate
model experiments. What we can learn from the past is
that the gap between wetting and drying is most likely
to sharply following the main crest of the Alps – with a
smooth transition over hundreds of kilometres less likely.
The last example concerns different long-term trends
in the third dimension, for which only a region like the
Alps can provide the necessary information. Namely, a
comparison of the annual mean air pressure evolution at
both low elevation stations and high elevation observato-
ries. In the Alps a number of summit observatories have
produced 100 to 150 years of air pressure series, opening
up the unique possibility of applying the principle of
‘relative topographies’ (calculating the virtual tempera-
ture of an air column from the ratio of the air pressure at
its upper and lower boundaries). The high elevation air
pressure curve has increased to a much greater degree
than the low elevation sites’ equivalent (which has also
increased). So, the principle mechanism is most accu-
rately explained by the measured air pressure series: the
air columns between low- and high-elevation measur-
ing sites have warmed, expanded and thus transported
more mass above the summit observatories, while the
total mass above the low elevation sites has only changed
due to large scale synoptic rearrangements. The prac-
tical importance of such independently measured ‘non
thermometric temperature series’ is high. If they show
the same warming as those measured directly using
thermometers, then this overrules once and for all the
argument that global warming is merely the product of
increasing heat islands in developing cities. This idea
has been described already in Auer et al.
3
and we are
currently working on an in-depth analysis of the concept.
Initial internal results show the feasibility of such an
analysis, but only under the condition of a carefully
homogenized series that allows the isolation of a climatic
signal of approximately 1 hectopascal/century from the
non-climatic noise of the original series.
is clear because of the high elevation sunshine, which is neither influ-
enced by low stratiform clouds nor by anthropogenic changes of
atmospheric turbidity (global dimming versus global brightening). As
a rule of thumb, we can state that the region has warmed by another
1°C beyond the given 1°C stemming from the global background.
Of course this covers only annual series averaged over the entire
GAR. For temperature this makes sense, as the average overall single
HISTALP series is highly representative for each of the sub-regions
concerning the decadal to centennial evolutions: they have warmed
at the same rate in Marseille, Karlsruhe, Budapest and Perugia, as well
as for the mountain observatories at altitudes between 2,500 (Säntis)
and 3,500 metres above sea level (Jungfraujoch). So the mountains of
the Alps may be more sensitive in respect to some climate impacts,
but they are not in terms of their reaction to climate forcing.
This similarity of temperature trends with respect to different
subregions is not applicable with regards to different seasons. In
general, 19th century winters were colder in comparison to summers
of the early instrumental period. This results in a general decrease
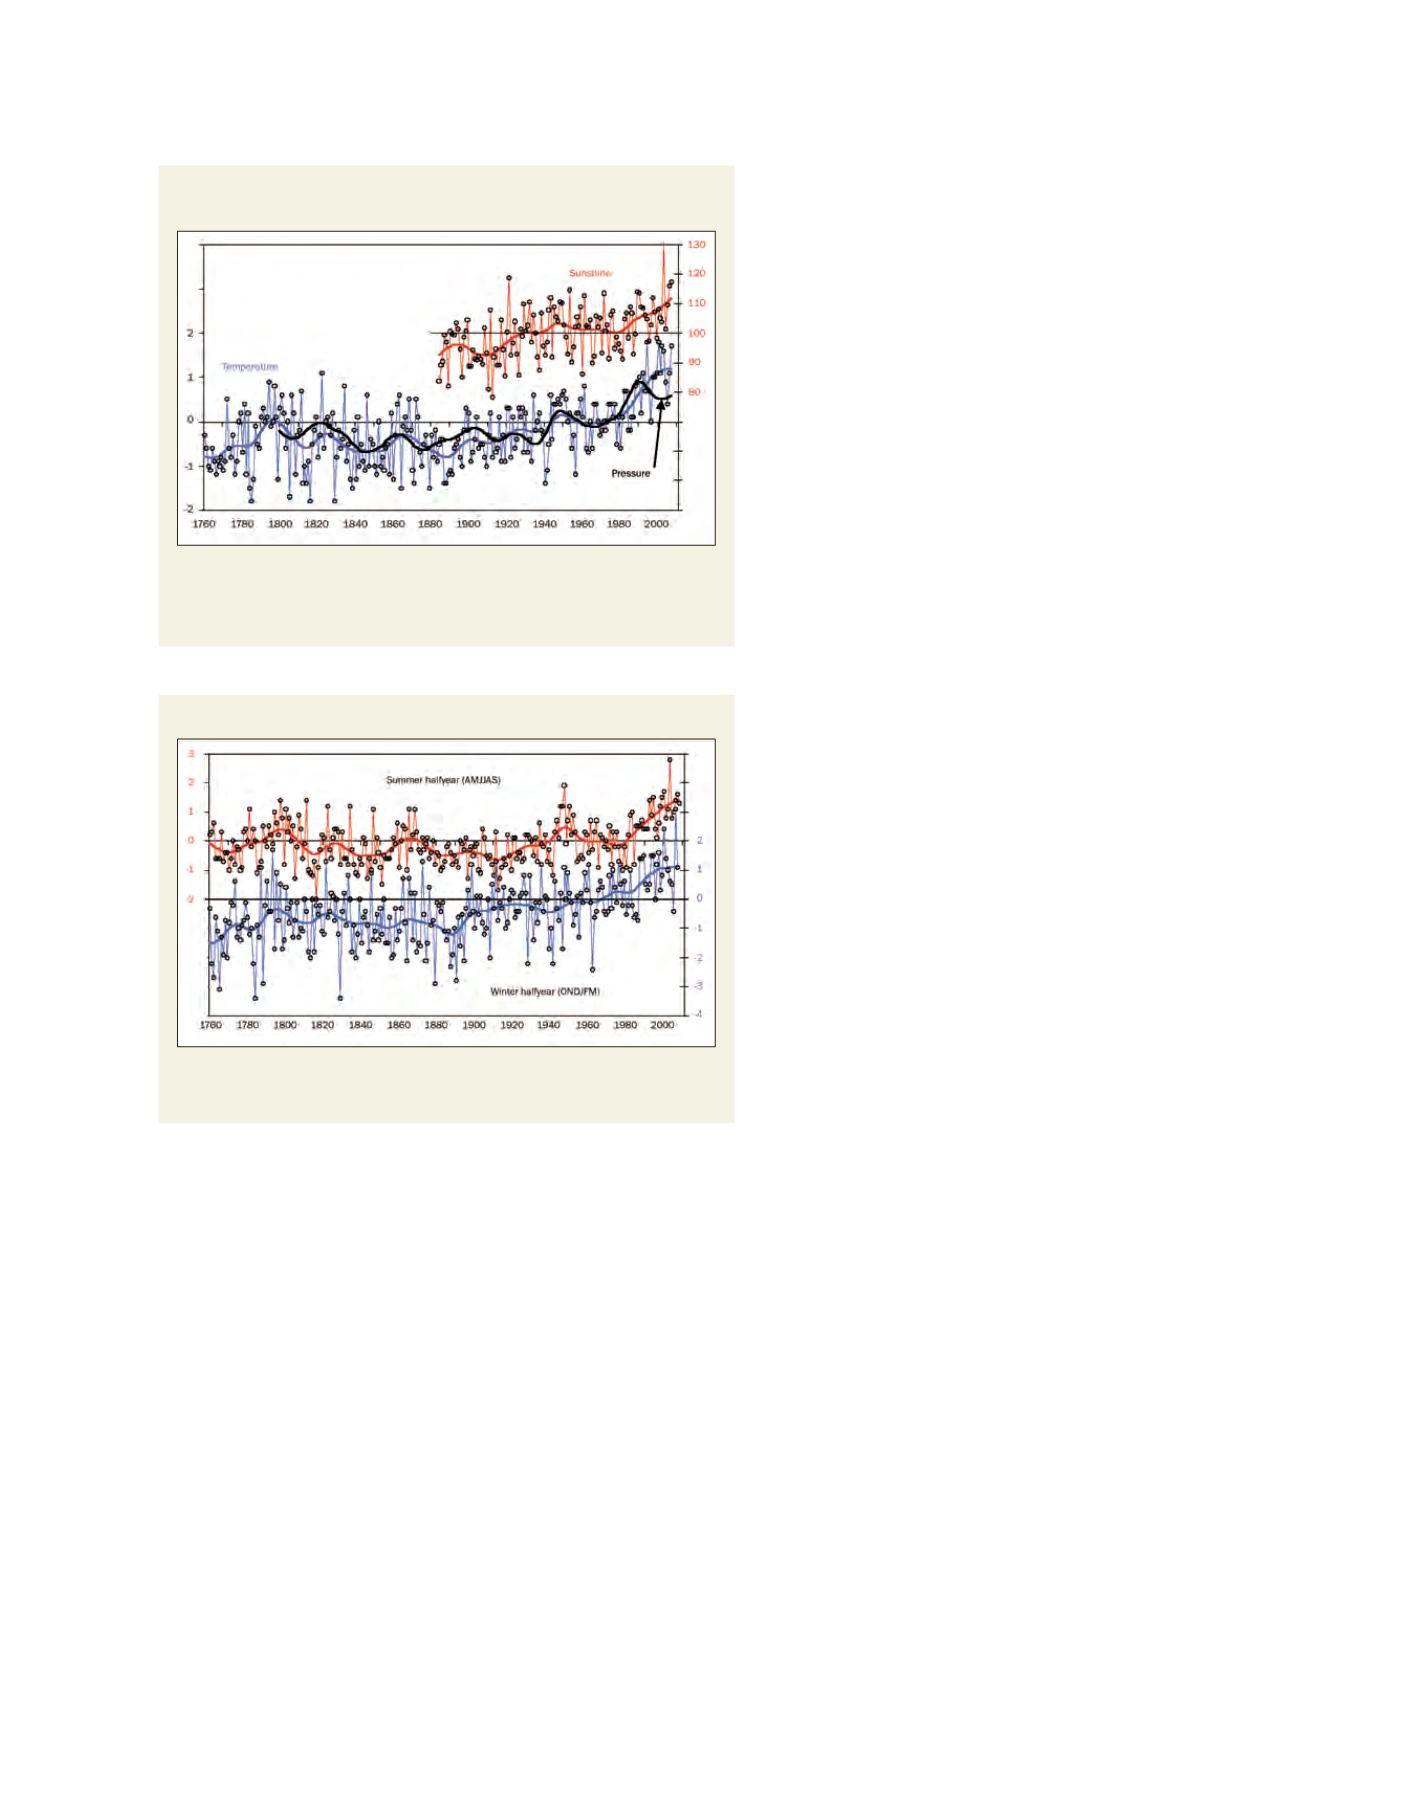
Regional annual mean time series of three closely linked climate
elements in the GAR
Blue shows a low elevation mean temperature, while red indicates high
elevation mean sunshine. Black shows low elevation mean air pressure and is
the only smoothed curve
Source:
www.zamg.ac.at/histalpGAR mean temperature between 1760 and 2007
Low elevation mean temperature series for the summer- and winter-half years
between 1760 and 2007
Source:
www.zamg.ac.at/histalp