


 22 / 258

[
] 20
those whose wealth derives from cash crops, while these
better-off family farms are differentiated from resource-
poor households that are employed locally. In the middle
are the food self-sufficient with a median level of productive
resource endowments, relying partly on part-time non-farm
activities.
10
In the Malian cotton zone, better-off family
farms possess two or more animal traction equipment units
and 10 or more cattle, while those with less than one animal
traction equipment unit and/or who only use manual labour
are the poorest, and those in between have one animal trac-
tion equipment unit and less than 10 cattle.
In Southern and Eastern Africa farm typologies are largely
based on the discrepancies in landholdings, alongside market
orientation. On average, small-scale family farms hold less
than 3 hectares of arable land and/or cropped areas; middle-
scale capitalist farms hold an average 10-200 hectares, and
LSCFs and plantations hold 500-3,000 hectares.
11
About
20 per cent of small-scale family farms are mainly market-
oriented producers of both food and cash crops, while the
rest are semi-subsistence producers focused on food crops.
Otherwise LSCFs are profit-oriented specialized cash crop
and/or livestock farms, mostly managed as corporate entities.
Contribution of family farms to agriculture
Although most family farms in SSA are largely devoted to
production for auto-consumption, they sell a limited but
significant amount of staple food crops and cash crops
harvested from relatively small areas. In general, family farm
production strategies are shaped by their diverse dietary
requirements, which are often structured around mass energy
staples, pulses and vegetables, with frugal supplies of animal
protein. Thus, family farms tend to allocate some (if not most)
of the family land and labour to producing their main staple
foods rather than cash crops, although a small proportion
of them specialize in the latter. However, when the volume
of produce from all family farms is aggregated, their output
dominates domestic agricultural production in SSA, despite
the higher financial value of the cash crops produced mainly
by LSCFs and better-off family farms.
The bulk of SSA cropped areas is worked by family farms, and
this area has increased by 85 per cent. The cropped area consti-
tuted 43 per cent of arable land area in 1961 and 50 per cent in
2012, showing that a larger proportion of arable land is used
for cropping. In per capita terms the rate of the cropped area
declined slightly considering the low level of inputs utilized on
the continent. Cropped area per capita decreased slightly from
0.24 ha/person in 1961 to 0.11 ha/person in 2012, whereas
arable land per capita declined sharply from 0.54 ha/person
in 1961 to 0.22 ha/person in 2013, which is approximately
1.3 hectares per family. This trend is striking because a higher
proportion of arable land is being cropped per capita, and the
available arable land is close to full utilization.
The scope of production and productivity among family
farms in SSA is differentiated according to their varied social,
agroecological and economic conditions, largely in relation
to their uneven extent and varied forms of integration into
different kinds of commodity and inputs markets. Their social
differentiation is reflected in the changing scale of their land-
holdings, cropped areas and livestock, the rise of wage labour
relations, greater shifts in the purpose of production towards
market, and their increased consumption of varied foods and
other consumer goods fromwithin the family farm and beyond.
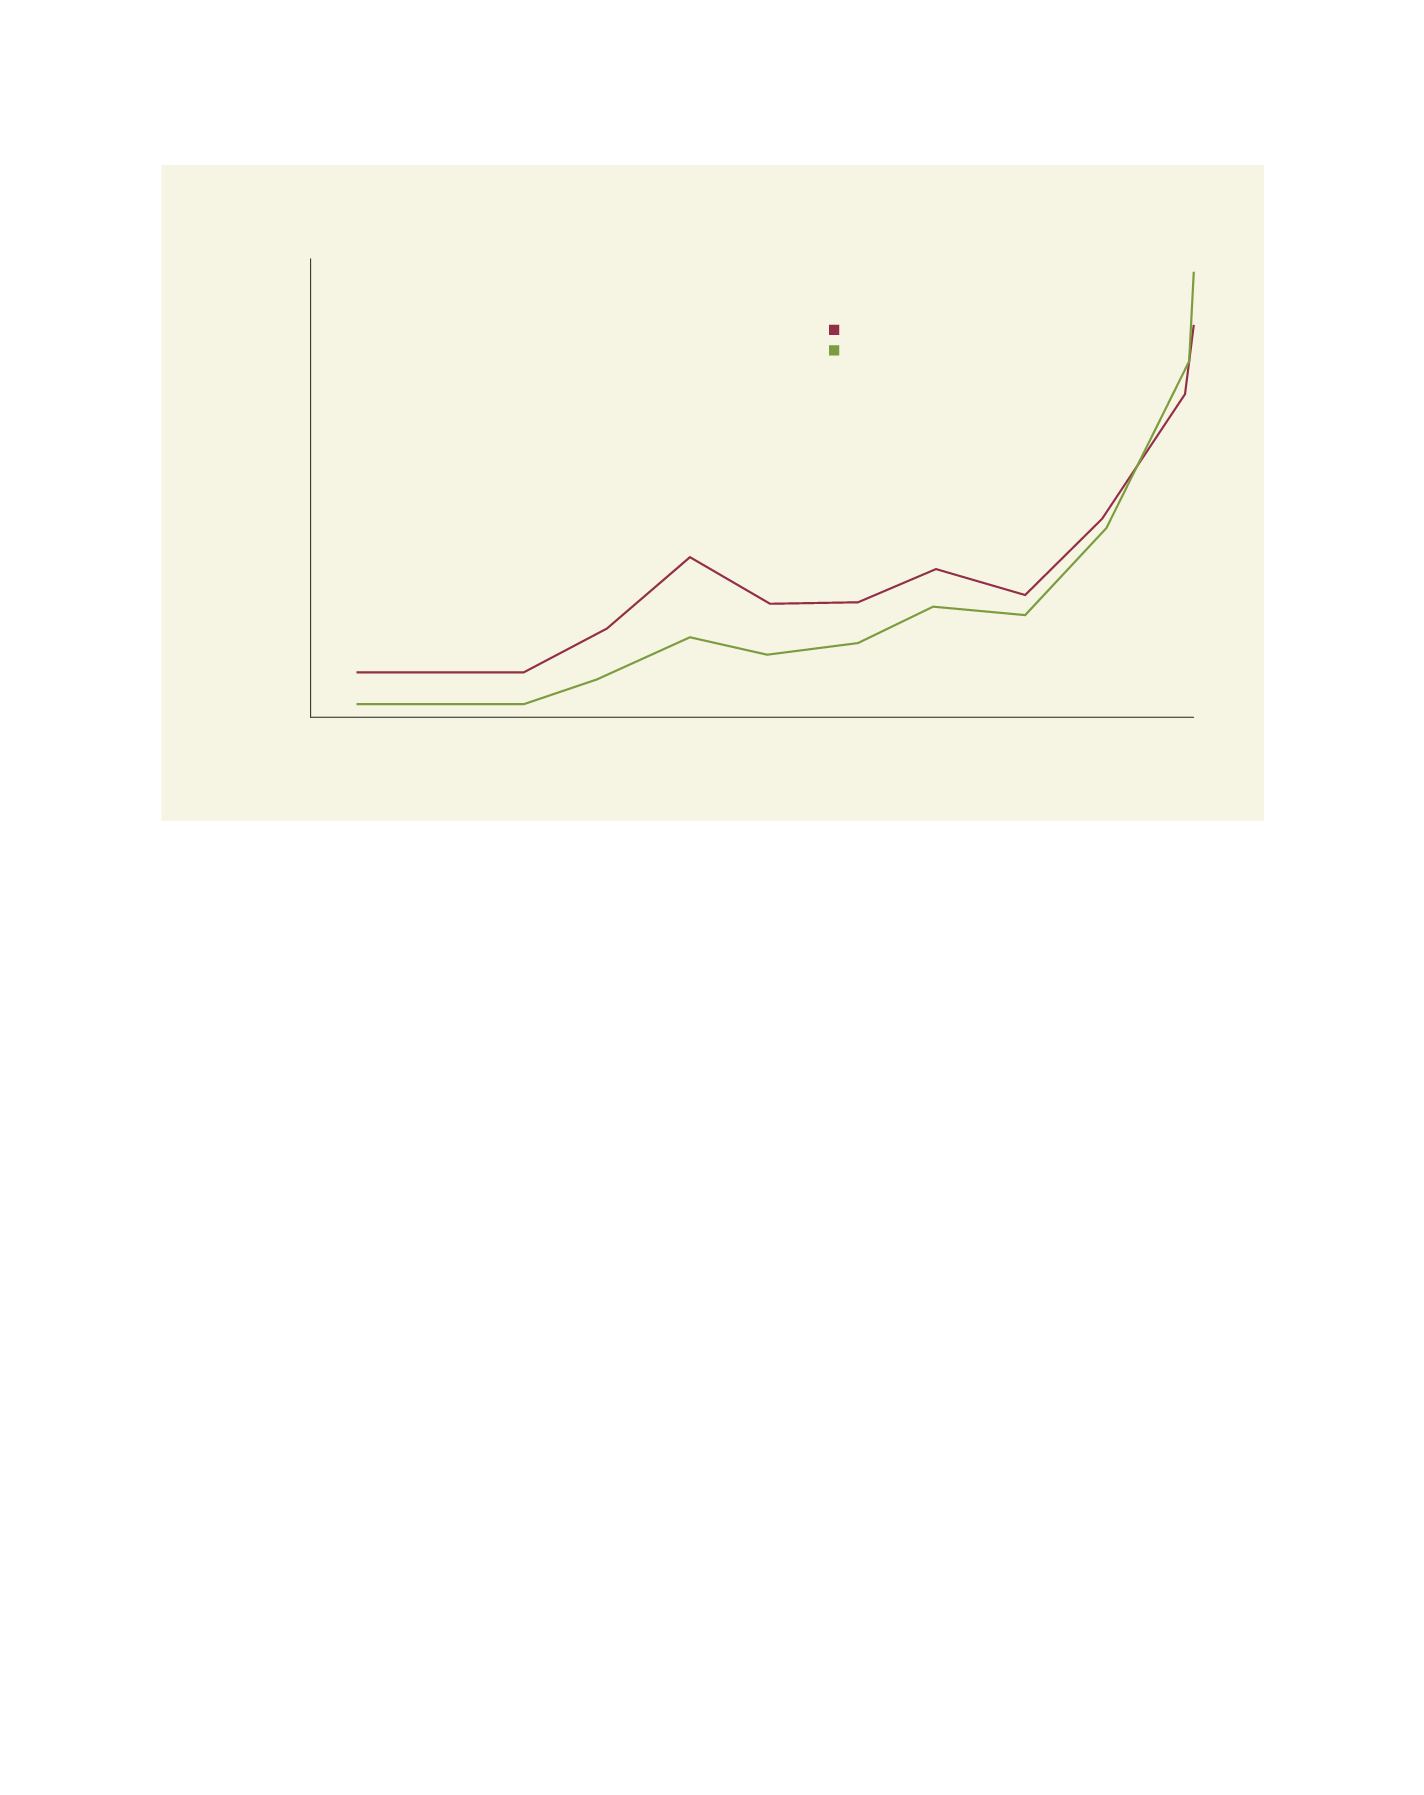
SSA agricultural imports in value and per capita
Source: FAO STAT 2014
1960
0
5,000,000
10,000,000
15,000,000
20,000,000
25,000,000
30,000,000
35,000,000
40,000,000
45,000,000
Import value (1,000 US$)
Imports p.c. (US$/person)
1970
1980
1990
2000
2010
Import value
Import value per capita
R
egional
P
erspectives