


 21 / 258

[
] 19
million to 562 million. This means that the number of families
dependent on farming may have trebled since 1961.
A fundamental factor which differentiates family farms from
LSCFs is that they use less hired labour. Most family farms hire
out their labour, while a few hire in labour from various sources,
and some do neither. Furthermore, family farms tend to be differ-
entiated according to the relative sizes of landholdings and levels
of capitalization (for example mechanization, irrigation) which
influence their operational scale and labour intensity. Such differ-
entiation is reflected in the varied levels of cropped areas and/
or livestock holdings, productivity and output (including food
surpluses) realized. While most contemporary family farms sell
a portion of their produce, some sell more than others. However,
fewer family farms obtain external finances (through various
credit circuits, contracts and remittances) to procure inputs and
implements and market their produce.
The spectrum of family farms therefore ranges at the top end
from the ‘better-off’ family farm (sometimes called the ‘rich’ or
‘capitalist’ family farm) that employs more hired labour than
family labour power and sells larger quantities of produce to
markets. These are often also referred to as market-oriented
family farms, living well above the poverty line.
7
At the bottom
end is the ‘poor’(near landless, semi-proletarian) family farm
that largely sells its labour to other farm and non-farm entities,
and hardly produces enough to meet family food requirements,
let alone to sell to markets. These family farms fall below
the poverty line and are at times labour-constrained family
farms,
8
often because of itinerancy of family members and/or
other social deprivations (such as the effects of HIV-AIDS). In
between is the middle or ‘semi-subsistence’ family farm. This is
the only category that has the semblance of an ideal-type family
farm which neither hires nor sells labour power, but produces
most of its food requirements and sells some produce to meet
a range of family needs.
Access to arable land is decisive in defining the inci-
dence and scope of family farm producers, as well as their
basic reproduction and survival. The constraints imposed
by increasing arable land scarcity and inequitable access to
the limited available arable land are important in shaping the
diversity of family farms. The rapid decline in arable land per
capita means that unless there is a demographic transition,
whereby rural population growth slows down more quickly or
there is increased farm productivity, the availability of arable
land for new family farms can be expected to end by 2030.
The combination of land and other forms of capital and labour
within family farms is not spread evenly within a single house-
hold, as it also tends to be differentiated according to gender
and generation. Generally, the patriarchs control the means of
production while women and children mainly provide largely
unwaged labour, and the management of family farms is largely
divided by gender, withmen being dominant in decision-making.
The marginalization of women in access to and control of family
land and farming resources remains an increasingly recognized
impediment to the development of family farms.
The classification of family farms according to their market
integration and/or cash cropping is commonly used through-
out SSA. In West Africa, the most commonly observed
categories include market oriented family farms with a cash
crop specialization, family farms which balance cereal and
cash crop production, and those with only subsistence cereal
holdings.
9
In Kenya and Uganda, family farms which rely
on permanent off-farm employment are distinguished from
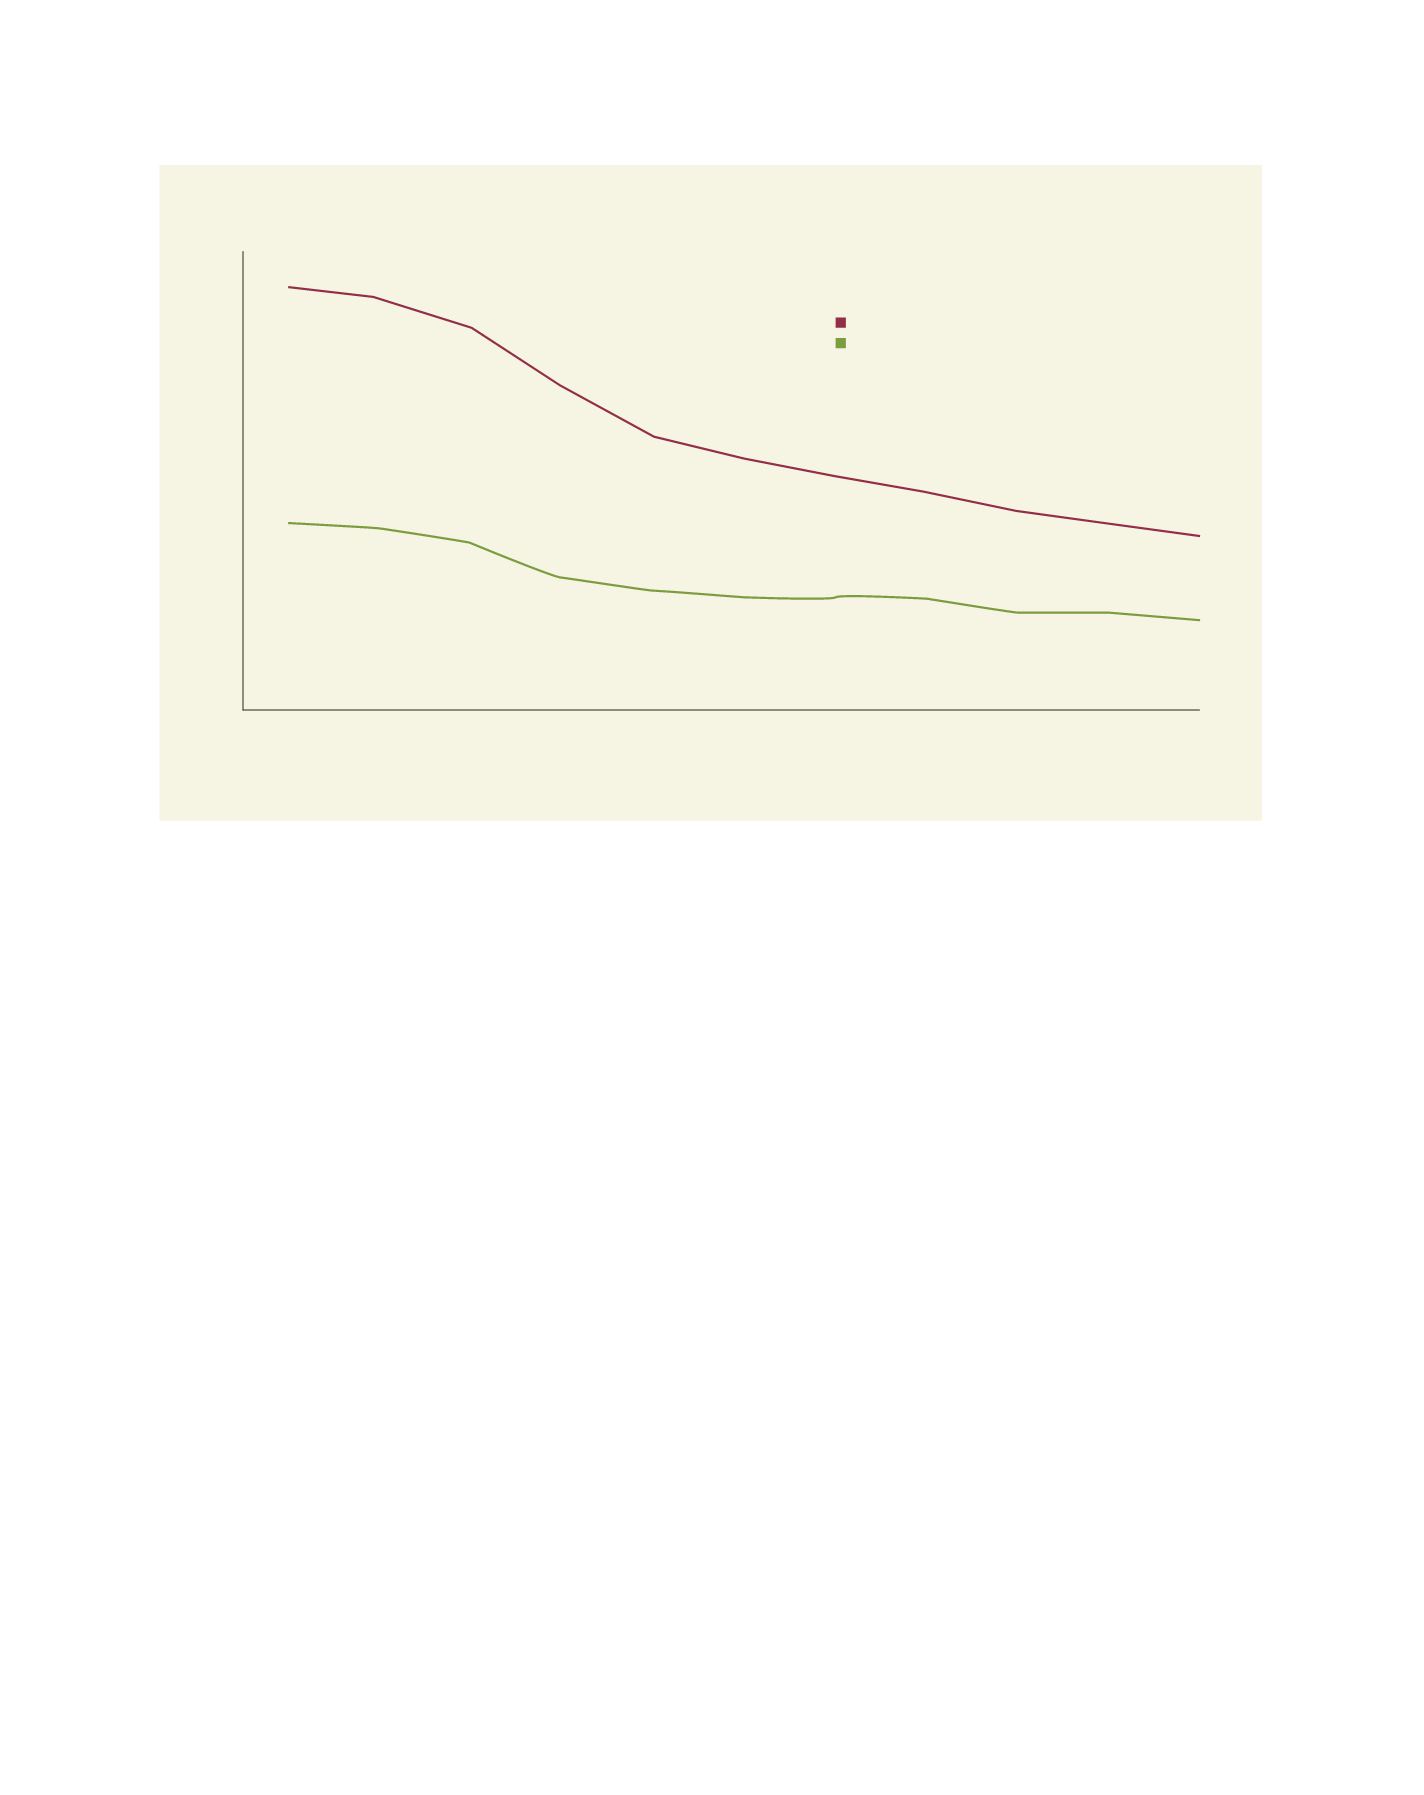
Arable land and cropped area per capita in SSA
Source: FAO STAT 2014
1960
0
0.1
0.2
0.3
0.4
0.5
0.6
Area per capita (Ha/person)
1970
1980
1990
2000
2010
Arable land per capita
Cropped area per capita
R
egional
P
erspectives