
[
] 79
in Borneo Island have involved both natural
3
and human
4
factors. By further validating the VISIT model with more
field survey and forest inventory data, this forest carbon
mapping approach will contribute to the establishment of
a forest carbon monitoring system for eastern Asia.
Methodological development
The study documented in this chapter used compos-
ite Normalized-Difference Vegetation Index (NDVI)
images from optical satellite sensors such as MODIS,
the National Oceanic and Atmospheric Administration
Advanced Very High Resolution Radiometer (NOAA-
AVHRR) and SPOT-VEGETATION data to map the
time series of forest cover change on Borneo from 1983
to 2008.
5
In the study, Advanced Land Observation
Satellite (ALOS)/PALSAR images were used as training
data for the forest cover map because PALSAR images
are more stable in difficult weather such as cloudy condi-
tions and the spatial resolution is higher than that of
MODIS images (1000-m spatial resolution). The forest/
non-forest map from PALSAR and an existing land cover
map produced by Boston University were used to fix
the threshold of forest versus non-forest areas. First we
mapped the forest/non-forest area in Borneo using a 2007
PALSAR mosaic image (50-m spatial resolution). Then
we fixed the threshold value between forest and non-
forest areas in a 2007 MODIS composite NDVI image.
The areas classified as forest on both the forest/non-forest
map and the existing land cover map were defined as
forest in the MODIS composite image, and the threshold
was fixed. Finally, we mapped the forest/non-forest area
from 1983 to 2008 by applying the 2007 threshold value
to MODIS, NOAA-AVHRR, and SPOT-VEGETATION
images from other years.
The space-borne Synthetic Aperture Radar (SAR)
sensor provides accurate measurements during daylight
hours and at night that are nearly independent of weather
conditions. Therefore, SAR technology provides an effec-
tive solution to map land cover in rainforest regions,
which are often under cloud cover. The PALSAR sensor
on ALOS includes several imaging modes, one of
which is fully polarimetric mode. The PALSAR polari-
metric antennas are able to transmit and receive both
orthogonal components (horizontal [H] and vertical [V]
polarization) of an electromagnetic wave, and these fully
polarimetric data allow more accurate mapping of the
land cover types.
In this case study, we investigated the ability of ALOS
/PALSAR L-band data at quad polarization (HH, HV,
VH, and VV) and 15-m resolution to produce accurate
maps of land cover types.
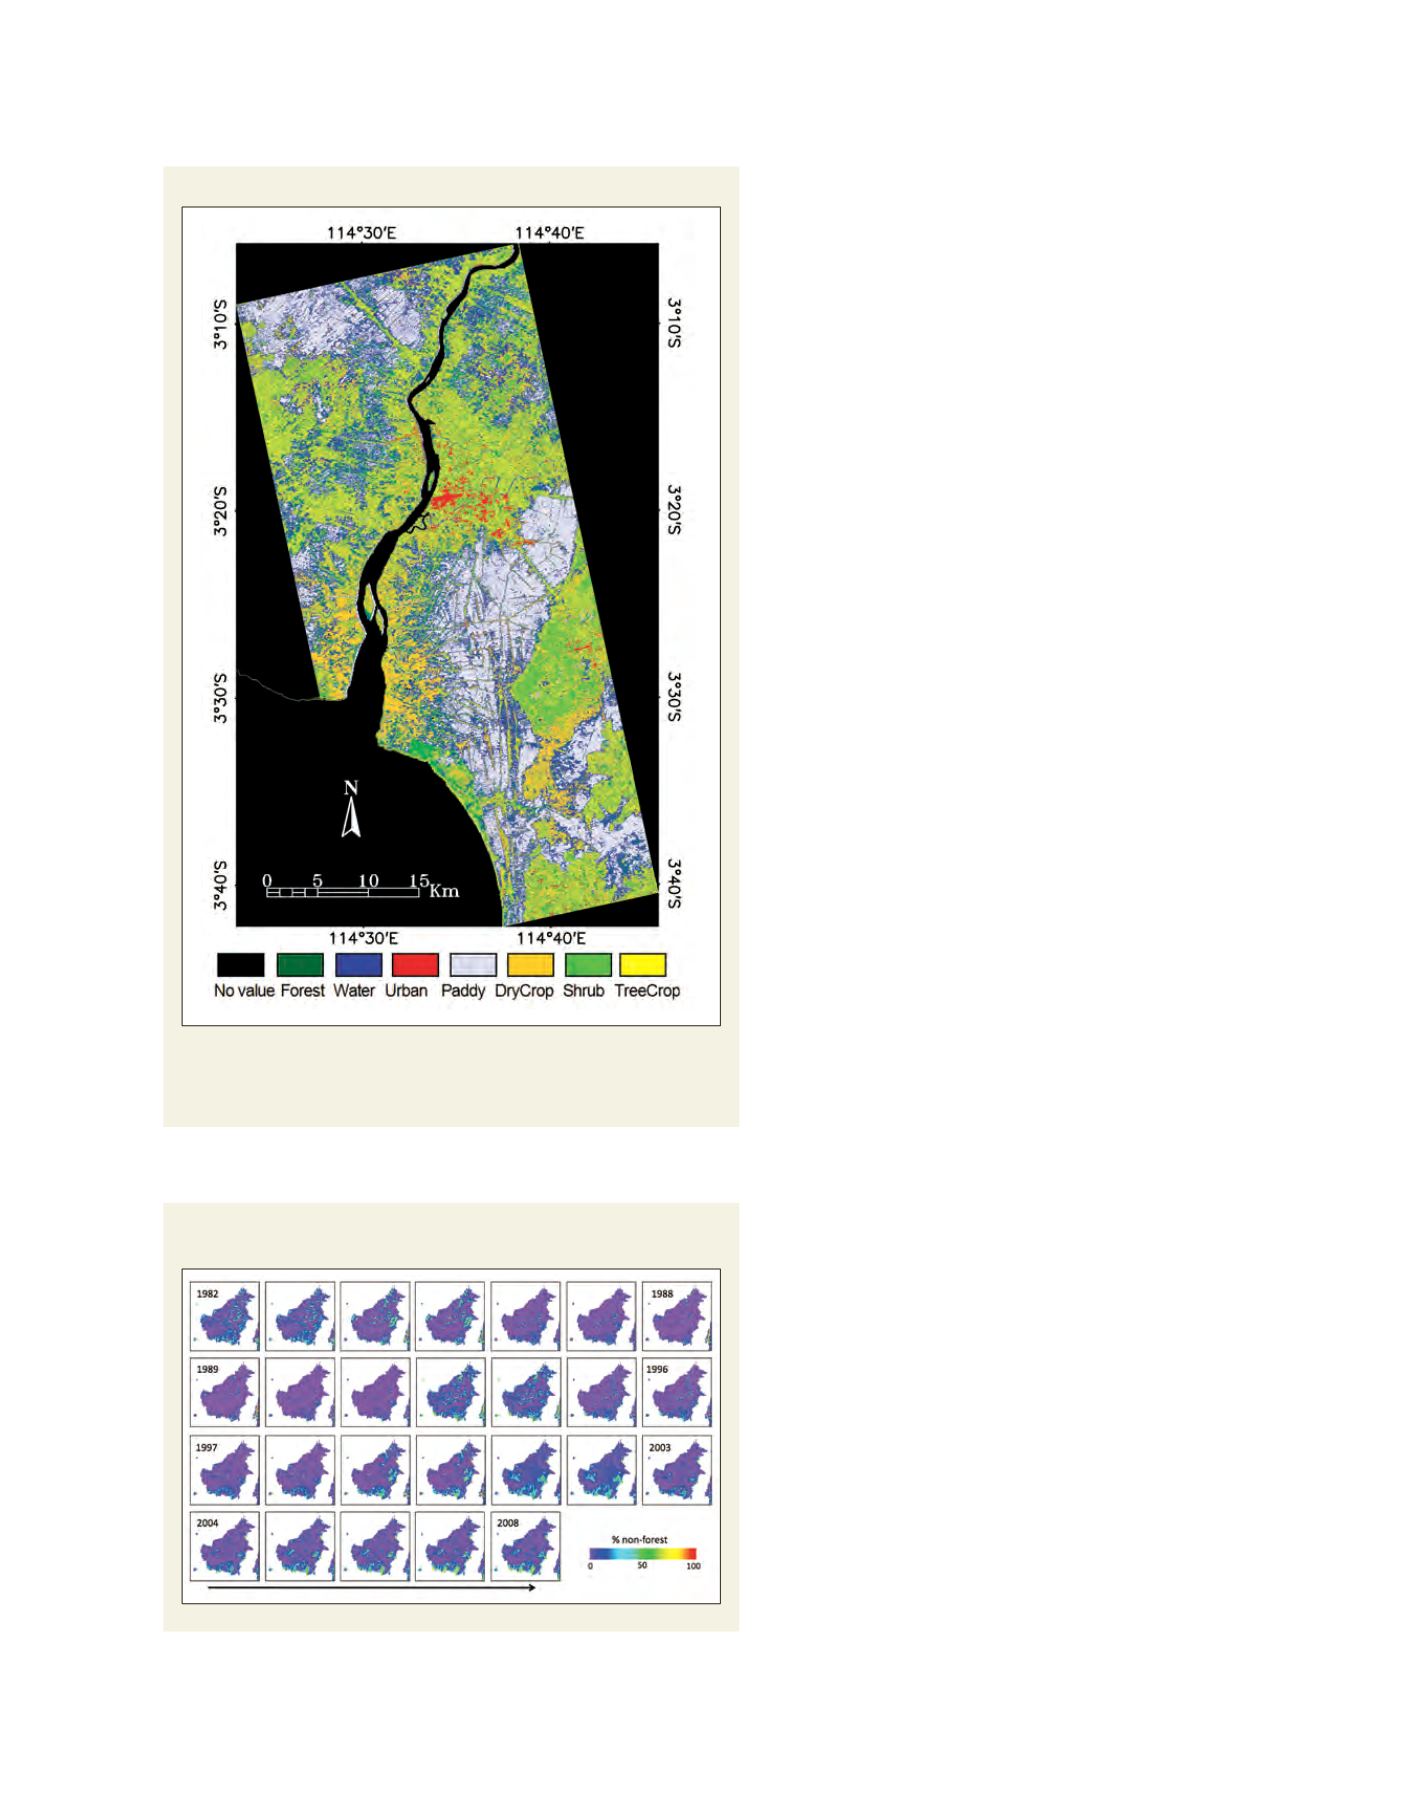
At the study area in south Kalimantan (Borneo),
Indonesia, we adopted the recently developed subspace
method for land cover classification.
6
Experimental
results indicated that when combining the polarimetric
coherency T3 matrix (derived from the fully polarimetric
Single Look Complex PALSAR data set) with intensity
images, the classification accuracy is higher than when
using only four-band (HH, HV, VH, VV) amplitude data.
Land cover classification map
Map derived from 13 bands of HH, HV, VH, and VV and the coherency T3 matrix
classified by the subspace method. The overall classification accuracy is 72.4
per cent with k = 0.6762
Source: Yamagata, Y., Takeuchi, W., Bagan, H., Ito, A. & Adachi, M. (2010)
Time-series of forest/non-forest cover of Borneo Island
captured by optical remote sensing data
Source: Yamagata, Y., Takeuchi, W., Bagan, H., Ito, A. & Adachi, M. (2010)


