
[
] 80
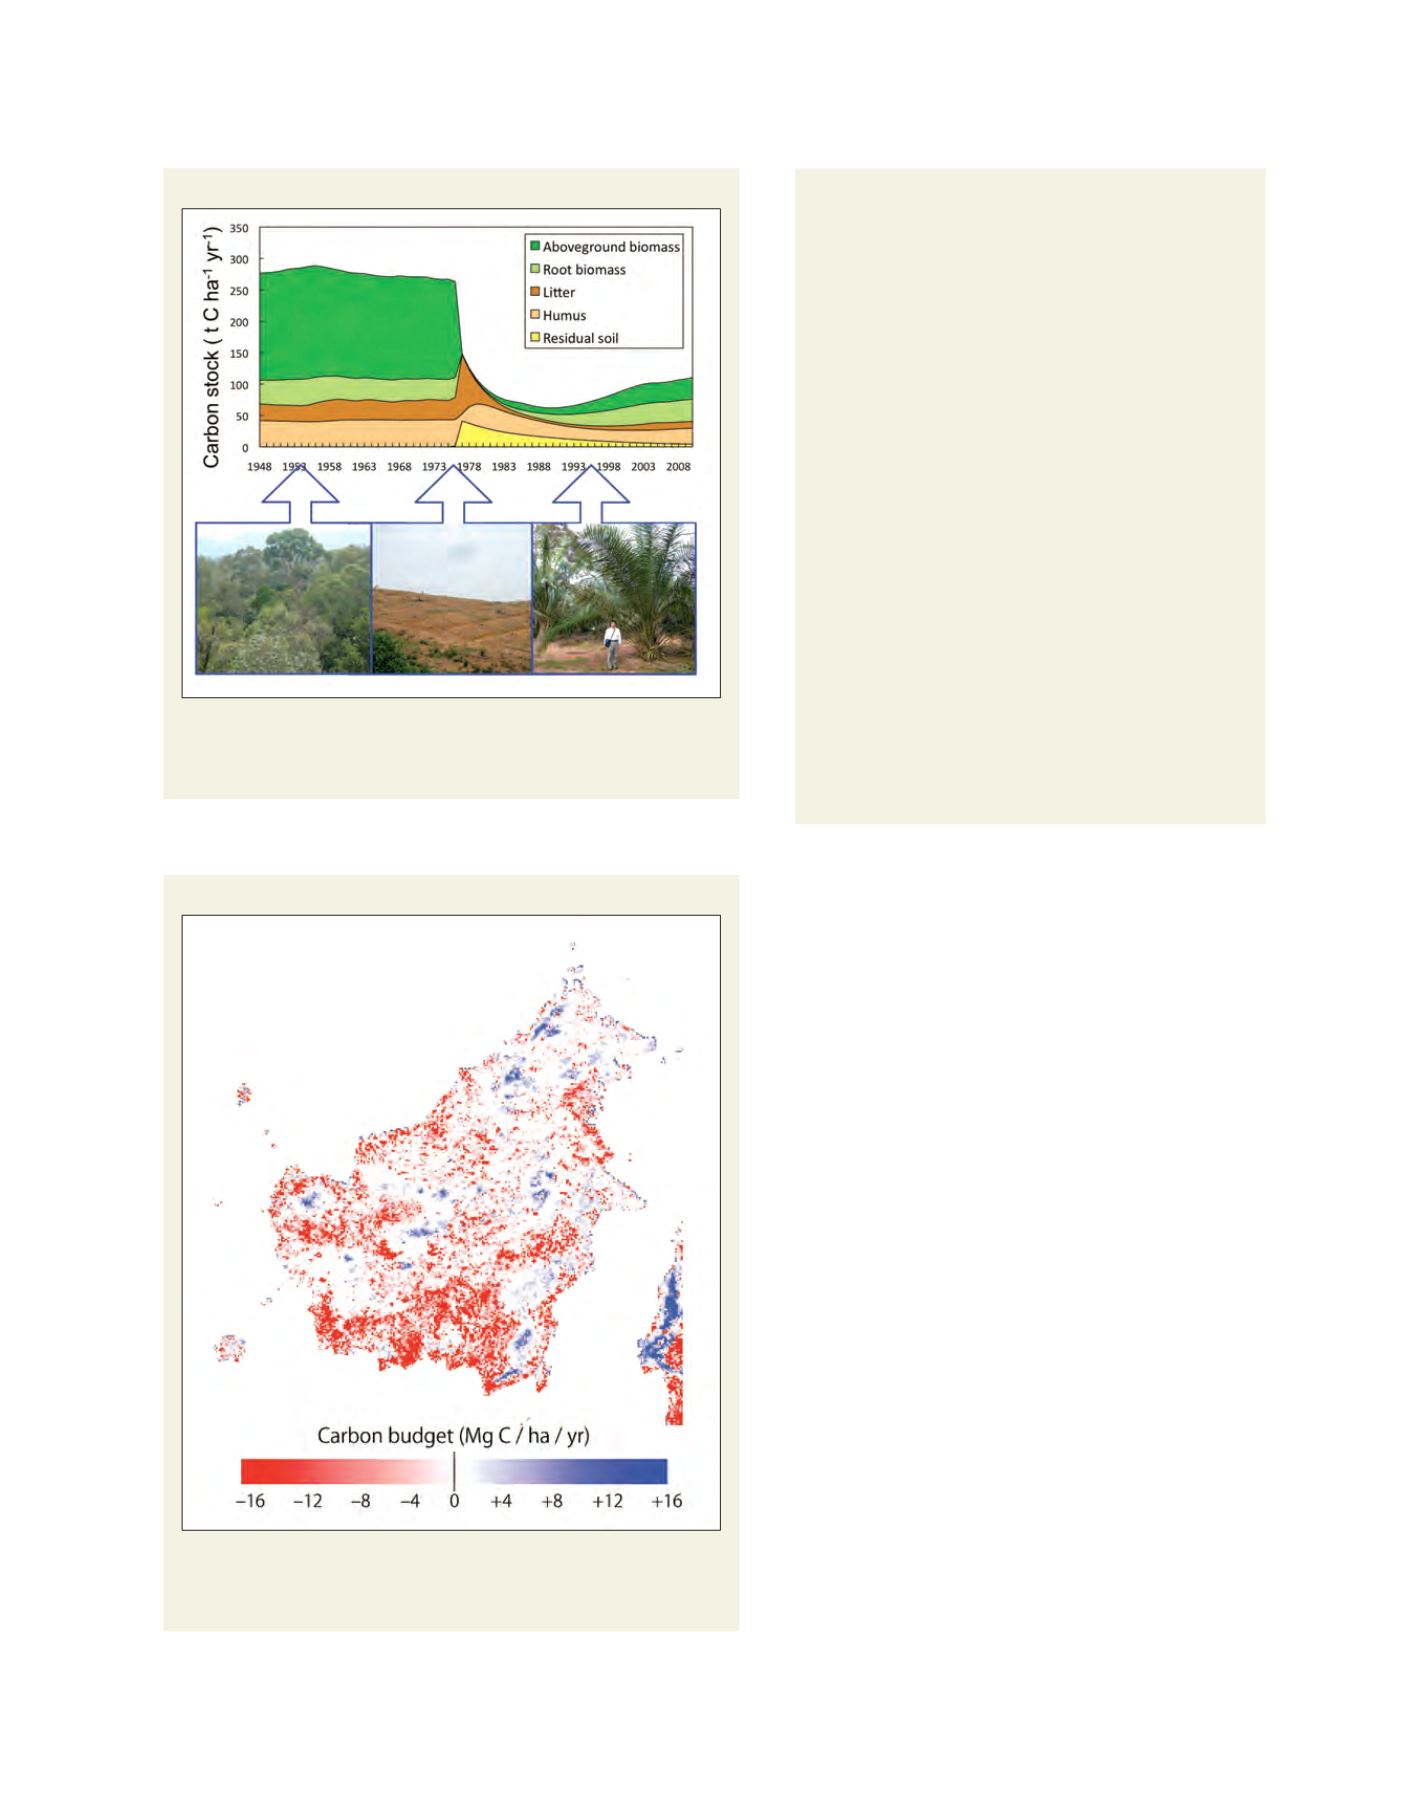
Detecting deforestation on Borneo Island
Deforestation on Borneo Island, Southeast Asia, was successfully
detected using the sequential variation in optical satellite
images to show the time series of forest cover change owing to
deforestation from 1982 to 2008. In each area where a forest
cover decrease was detected, the model estimated carbon
emission after logging and subsequent carbon accumulation in
regrowing vegetation. Based on these data, we produced a map of
the net carbon budget induced by deforestation on Borneo Island.
Our results suggested that the southern part of the island was a
large carbon source due to deforestation, especially in southern
areas, although the VISIT model needs be revised to account
for tropical peatlands. Moreover, we need to verify the results of
the model simulation using field observations to understand the
impacts of deforestation on the net carbon budget of ecosystems
in Southeast Asia. For instance, above-ground biomass in primary
forest in Borneo Island was reported to be 497 Mg ha-1 in 2002,
the highest rate among the tropical forests of Southeast Asia.
9
The impact of deforestation would be larger than that in other
regions, therefore acquiring more detailed estimations of carbon
emissions induced by deforestation is one of the most important
environmental research tasks. We are currently improving the
prototype system by using multi-time ALOS/PALSAR data, because
cloud-induced noise remains in the current forest map. Also, the
terrestrial ecosystem model should be revised to account for
local factors such as peatlands and historical factors such as
the disturbance chronology before 1983. This monitoring system
is expected to contribute to the Forest Carbon Tracking task by
the GEOSS and relevant activities toward mitigation of climate
change and biodiversity loss, especially as a part of the Monitoring,
Reporting and Verification (MRV) system for the REDD.
The classification results confirmGastellu-Etchegorry’s
1988 finding that fewer Landsat and SPOT scenes have
cloud cover percentages of less than 10 per cent from
1972 to 1987 in Indonesia than in other years.
7
Figure 3 also shows the cloud cover situation of
ALOS/Advanced Visible and Near Infrared Radiometer
type 2 (AVNIR-2) optical sensor images acquired from
11 December 2009 to 29 July 2010 in the study area. It
is difficult to extract land cover information by using
the single scene cloud cover optical images due to
cloud cover.
A model-based carbon accounting method was
developed, including disturbance impacts by forest
reduction and degradation on the ecosystem carbon
budget. The study adopted a VISIT process-based
model, which simulates atmosphere–ecosystem gas
exchange and carbon–nitrogen–water cycles in ecosys-
tems at a daily time step. The model allowed us to
estimate changes in carbon sinks and sources induced
by climate change and by natural and human distur-
bances, including land-use conversion from primary
forest to cropland.
The biogeochemical carbon flows in the VISIT model
are calculated based on models of the ecophysiological
responses of the vegetation to environmental param-
eters. VISIT has been calibrated and validated using
field data from Southeast Asian tropical ecosystems.
8
By
combining the satellite-based forest/non-forest map and
the terrestrial model, we were able to develop a proto-
type of a broad-scale, spatially explicit forest carbon
monitoring system.
Temporal variation in carbon stock
The study case of the estimated temporal variation in carbon stock using the
VISIT model during the period 1948-2010, including land-use conversion from a
primary forest to an oil palm plantation in 1976
Source: Yamagata, Y., Takeuchi, W., Bagan, H., Ito, A. & Adachi, M. (2010)
Net carbon budget of Borneo Island in 2008
Results of cumulative forest cover change during the period 1982-2008
estimated by the terrestrial ecosystem model. Red areas show net carbon
sources to the atmosphere, and blue areas show net carbon sinks
Source: Yamagata, Y., Takeuchi, W., Bagan, H., Ito, A. & Adachi, M. (2010)


