


 165 / 192

[
] 165
The UNCCD’s 11th Conference of Parties in 2013 took the
first step in this direction by deciding to establish its Science-
Policy Interface, which started functioning as of June 2014.
This included motivating and assisting the Intergovernmental
Platform of Biodiversity and Ecosystem Services to set and to
carry out a thematic assessment of land degradation and resto-
ration, whose findings would assist in guiding responses to land
degradation, including attainment of LDN at all scales.
One stumbling block for applying effective responses to land
degradation is that the UNCCD is directly relevant to only 34.5
per cent of global land since its mandate is restricted to drylands
only.
14
But loss of biological or economic productivity resulting
from processes spelled out by UNCCD text also occurs in most
of the other 64.5 per cent of global land, regardless of whether
it is exposed to risk of land degradation or desertification. For
example, land degradation in China depends more on land use
than on whether it is dryland or not. Other evidence of severe
land degradation in non-drylands is being increasingly detected.
15
In addition, non-drylands also abound in most ‘dryland coun-
tries’: only 43 per cent of these countries have drylands covering
more than 95 per cent of their territory, and in about third of the
dryland countries, drylands take up less than 50 per cent of their
territories.
16
Desertification national action plans compiled by
dryland countries, pursuant to their commitments as parties to
the UNCCD, address land degradation while ignoring the deline-
ation of drylands within their territories.
Furthermore, the climatic boundary of the drylands was set at
an aridity index value of 0.65,
17
that is to say areas where the ratio
of precipitation to potential evapotranspiration is higher than 0.65
do not qualify as drylands. The aridity index used for mapping
the global drylands
18
was based on the rainfall and tempera-
ture means for the period 1951-1980. However, the directional
anthropogenic climate change undermines the stability of the
aridity index and changes the spatial expase of the drylands. Most
of Africa, for example, has become drier: the hyper-arid and arid
drylands increased by 51 and 3 million hectares respectively, and
the non-drylands of 1931-1960, ‘lost’ 25 million hectares. Finally,
rainfall decreases and evapotranspiration increases are projected
to intensify this trend in many drylands by mid-century.
19
Thus,
lands identified as non-drylands due to their climatic conditions
during 1950-1980 already qualify, and many more will qualify as
drylands in the future, making the current distinction between
the UNCCD drylands and non-drylands redundant.
Finally, recalling that land degradation impacts biodiversity
and exacerbates global climate change, expanding the focus of
UNCCD to cover all lands and their soils would also enable the
addressing of land and soil issues at the global scale. Jointly with
the Convention on Biological Diversity and the United Nations
Framework Convention on Climate Change, addressing the land-
biodiversity-climate interlinkages would comprise an effective
framework for holistically securing the living land’s life-support
system of the planet.
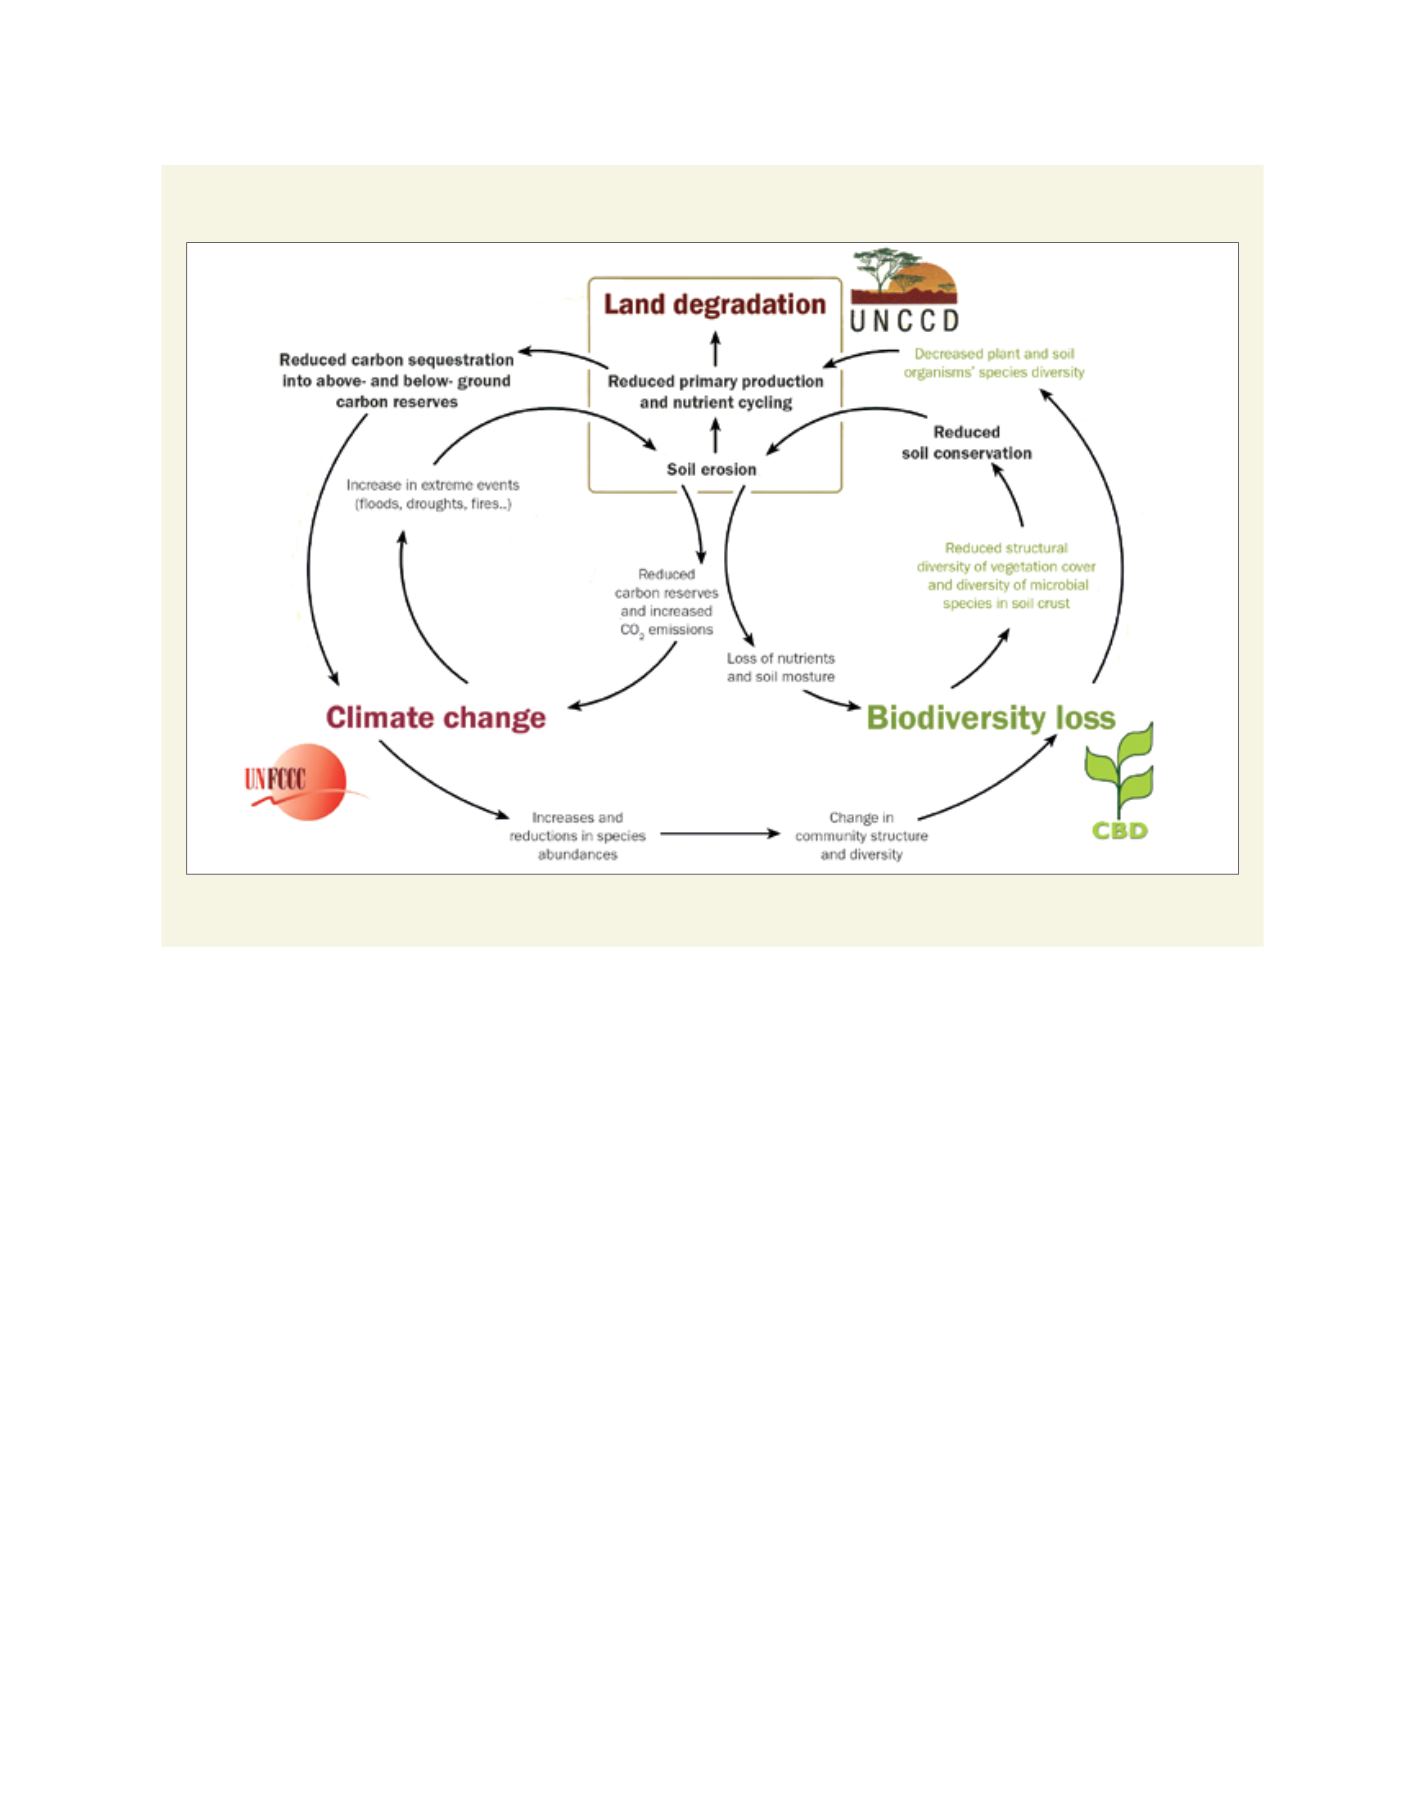
Land degradation, climate change and biodiversity loss are mutually reinforcing nested feedback loops
Source: Millennium Ecosystem Assessment. Adapted from Adeel, Z. et al, 2005
20
L
iving
L
and