


 135 / 288

[
] 136
D
isaster
R
isk
R
eduction
ture to conclude the effectiveness of the new climate information
services and identify possible related problems. JMA and NARO/TARC
will continue to supply the new information on a trial basis in summer
2012 towards its operational provision in the near future.
Success factors
The pilot project was successful both for JMA and for NARO/TARC.
In particular, JMA gained significant expertise on developing better
climate information services. Some keys to the initiative’s success
and lessons learnt from it are summarized below:
• It is critical for climate information users and providers to
engage in close and productive dialogue and to share knowledge
due to the nature and difficulty of climate prediction and
information. JMA and NARO/TARC frequently shared relevant
information both by e-mail and at face-to-face meetings, which
supported the success of the project.
• Intermediaries linking providers and end users of climate
information are very important in promoting its use. In the pilot
project, NARO/TARC and its researchers acted as intermediaries
between JMA and end users in the agricultural sector.
• Effective use of existing systems, as well as support from partners,
contributes to the smooth and successful launch of new services.
In the project, experimental provision of the new information was
effectively carried out using existing systems operated by NARO/
TARC in collaboration with the IPU, which offered useful support
as it specializes in information technology. Making the most of its
experience to implement the pilot project, NARO/TARC took steps to
improve its agro-meteorology information based on user feedback.
Future plans and expectations
Based on the success of the pilot project with NARO/TARC, JMA held
discussions with NARO (the higher authority of NARO/TARC) with a
view to efficiently expanding such collaboration to initi-
ate similar projects in other regions. Currently, JMA is
involved in four pilot projects in conjunction with four
regional agricultural research centres under NARO. In
addition, recognizing the effectiveness of tailored climate
information in the agricultural sector, JMA has begun
discussions with Japan’s Ministry of Agriculture, Forestry
and Fisheries (which oversees and connects all stake-
holders in the agricultural sector, including those within
local governments) to develop better partnerships with
the sector and promote further development and effective
use of climate information services beneficial to various
agricultural activities.
JMA is further seeking opportunities to collaborate with
operators in other fields, including the energy sector, in
order to provide greater levels of usefulness and tailoring
in its climate information services. Such collaboration is
expected to promote efficient climate information services
that are beneficial in a variety of socioeconomic activities.
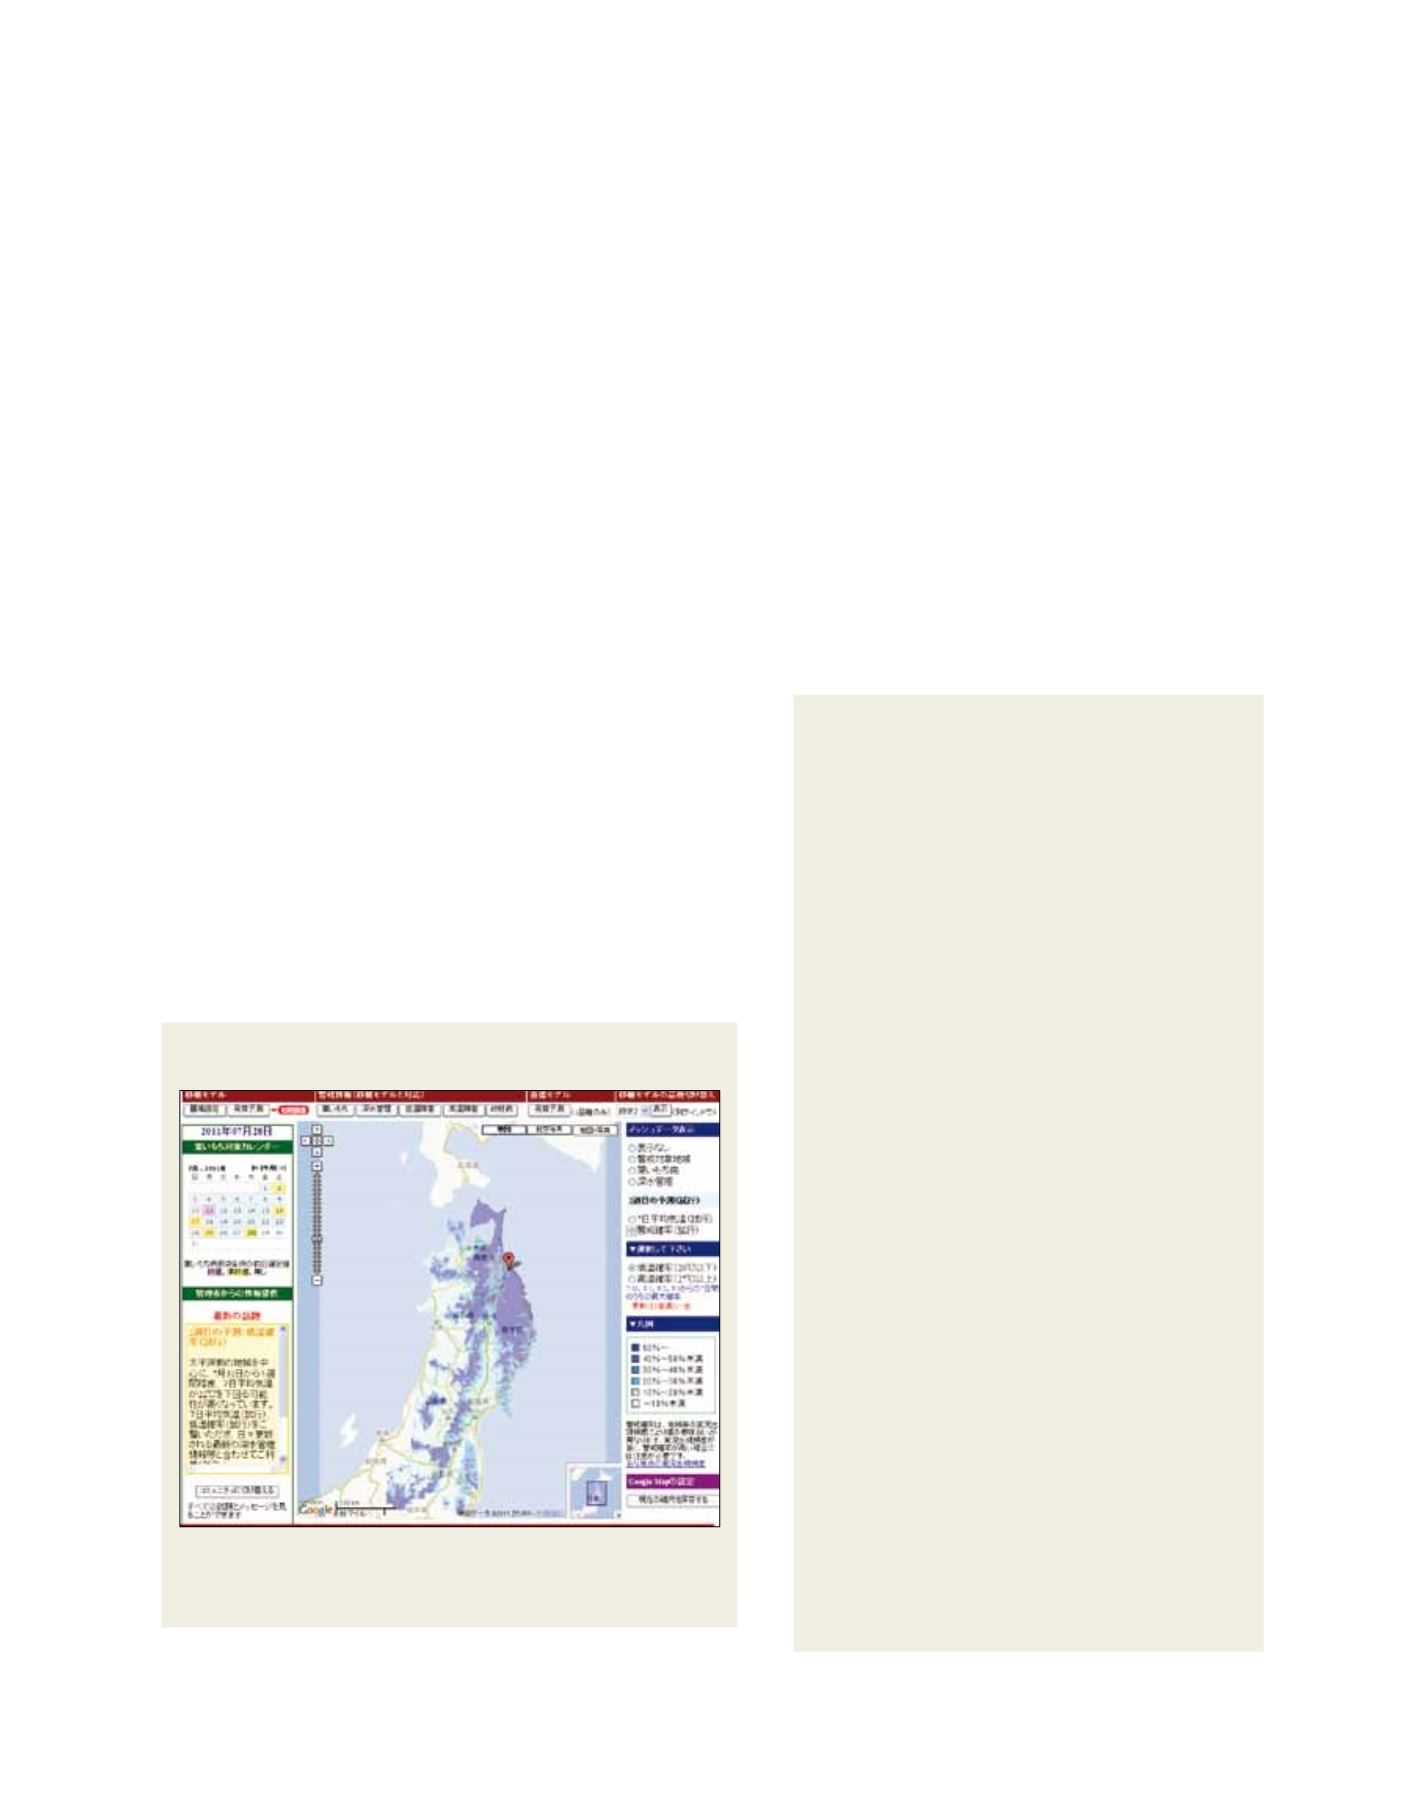
A map for the experimental provision of temperature
prediction to specific users (in Japanese)
Source: JMA
Temperature prediction at a 1 km resolution
T7d prediction at a 1 km resolution was made based on
a combination of two data sets: NARO/TARC provided
climatological normals of T7d at a 1 km resolution
covering the 30-year period from 1981 to 2010, while
JMA provided PDF prediction data for regional-scale
T7d anomalies for the Sea of Japan side and the Pacific
Ocean side of the Tohoku region.
The climatological normals of T7d in more than
70,000 1 km grids in the Tohoku region were calculated
from historical records of daily mean temperatures
(T1d), which were statistically estimated using surface
observation data of T1d and geographical information at
a 1 km resolution. These observation data were obtained
from a network of automated weather stations operated
by JMA, known as the Automated Meteorological Data
Acquisition System (AMeDAS).
JMA provided predicted PDFs of regional-scale T7d
anomalies that are made twice a week for EWIEW. The
PDFs were calculated using both numerical prediction
data from JMA’s operational one-month Ensemble
Prediction System (EPS) and regression coefficients
estimated from hindcast experiments (re-forecasts)
for 1981-2010, which were carried out with the same
system as that in operational use. To calculate the
predicted PDFs of T7d at a 1 km resolution with respect
to actual temperatures (rather than in three operational
categories), two steps must be completed: statistical
downscaling for predicted PDFs of T7d anomalies from a
regional scale to a 1 km resolution, and addition of the
PDFs to the climatological normal.
When the predicted PDFs were changed from a regional
scale to a 1 km resolution, the mean values were
assumed to be uniform and equal to that in each region.
However, PDF variances are thought to differ for each 1
km grid even in the same region. Accordingly, differences
in variances caused by the different spatial scale were
estimated using historical records of temperature at
a 1 km resolution provided by NARO/TARC. Based on
this estimation, PDFs of the T7d anomaly at a 1 km
resolution were calculated from the regional-scale
values. After this process, the PDFs were added to the
climatological normals for each 1 km grid so that users
could use the PDFs in view of actual temperatures rather
than anomalies. This facilitated user understanding and
supported use in decision-making.
Users can select mean values of the seven-day mean temperature (T7d) and the
predicted probability of T7d values at or below (above) 20 (27)° C at a 1 km resolution
for the period from one to two weeks ahead of 27 July, 2011, on the website