


 134 / 288

[
] 135
D
isaster
R
isk
R
eduction
a higher level of skill than the climatological value of T7d for the
period up to two weeks ahead. It was also found that the prediction
skill for the probability of T7d values, at 20° C or below and 27° C or
above, was reasonable. JMA verified this in relation to past extreme
events, including the very high temperatures seen in 1994 and the
very low temperatures seen in 2003, and found realistic temperature
distributions and variations of the prediction comparable to actually
observed values.
Experimental provision of climate information
During summer 2011, JMA and NARO/TARC experimentally
provided the new climate information through a website to regis-
tered users (see map image on next page). In fact, NARO/TARC,
in collaboration with the Faculty of Software and Information
Science at Iwate Prefectural University (IPU) had operated a
website providing weather and related tailored information
aimed at reducing rice crop damage even before the pilot project
was implemented. Under the project, NARO/TARC further
customized information to users and improved the web system
to provide new climate information covering the period up to
two weeks ahead. The data included mean T7d predictions and
the predicted probability of T7d values at 20° C or below and
27° C or above for each 1 km grid, covering the period from one
to two weeks ahead. On the website, users could also view time-
sequence information for specific registered points, including
predicted T7d values and their variability (standard deviation)
and the predicted probability of T7d values at the levels described
above. The site also included maps showing the climatological
occurrence of the high and low temperatures and
related interpretation. When the predicted probability
of T7d reaching the alarming temperature was high
at a registered point, an alert was automatically sent
to users’ e-mail terminals and mobile phones. For
example, if the possibility of temperatures at or below
20° C was high, users received an alert so that they
could increase water levels in rice fields to protect
against low-temperature-related damage.
After the experiment of July 2011, NARO/TARC and
the IPU conducted an e-mail questionnaire survey. The
questionnaire was distributed to the 154 users who partic-
ipated in the experiment, and 89 replies were received.
Unfortunately (as far as the experiment is concerned),
no remarkably high or low temperatures occurred during
the trial period, meaning that few alert messages were
sent. Nonetheless, a number of respondents clearly indi-
cated the usefulness of the information provided during
the experimental period. Others underlined the need
for climate information covering the period up to two
weeks ahead. The results of the survey indicated that the
experimental provision was fruitful, in that it highlighted
agricultural users’ need for longer-range forecasts in the
Tohoku region and clarified that the provision of tailored
climate information offers potential benefits to farmers.
These findings were an important outcome of the pilot
project. However, as no extremely cold conditions were
seen during the experimental period in 2011, it is prema-
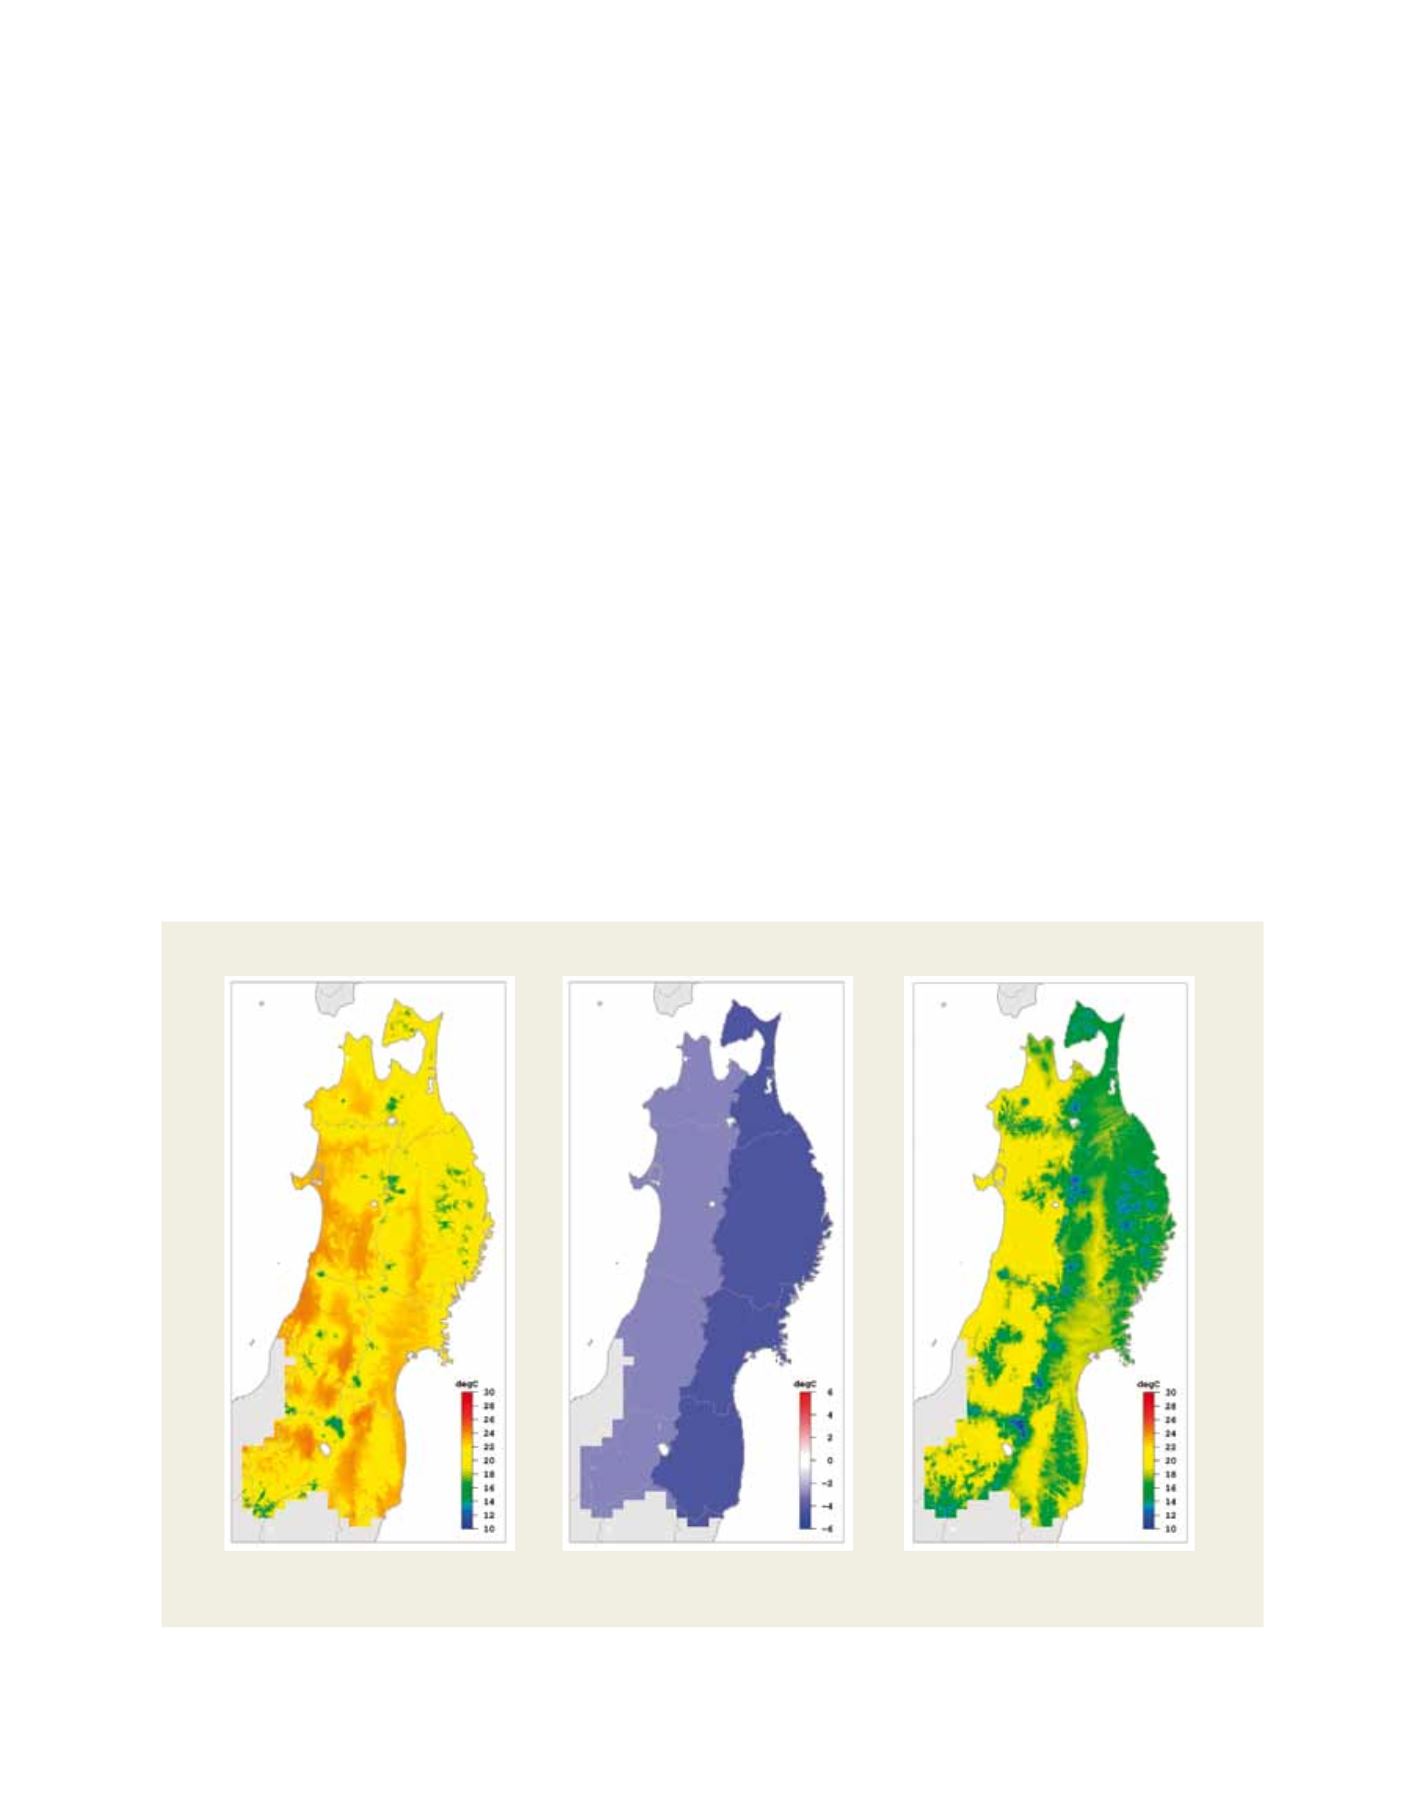
Seven-day mean temperature (T7d) prediction at a 1 km resolution in the Tohoku region of Japan
Source: JMA
(a) Climatological normal of T7d at
a 1 km resolution
(b) Mean value of predicted regional-scale
T7d anomalies
(c) Mean value of predicted T7d at a 1 km
resolution (= (a) + (b))