


 138 / 288

[
] 139
D
isaster
R
isk
R
eduction
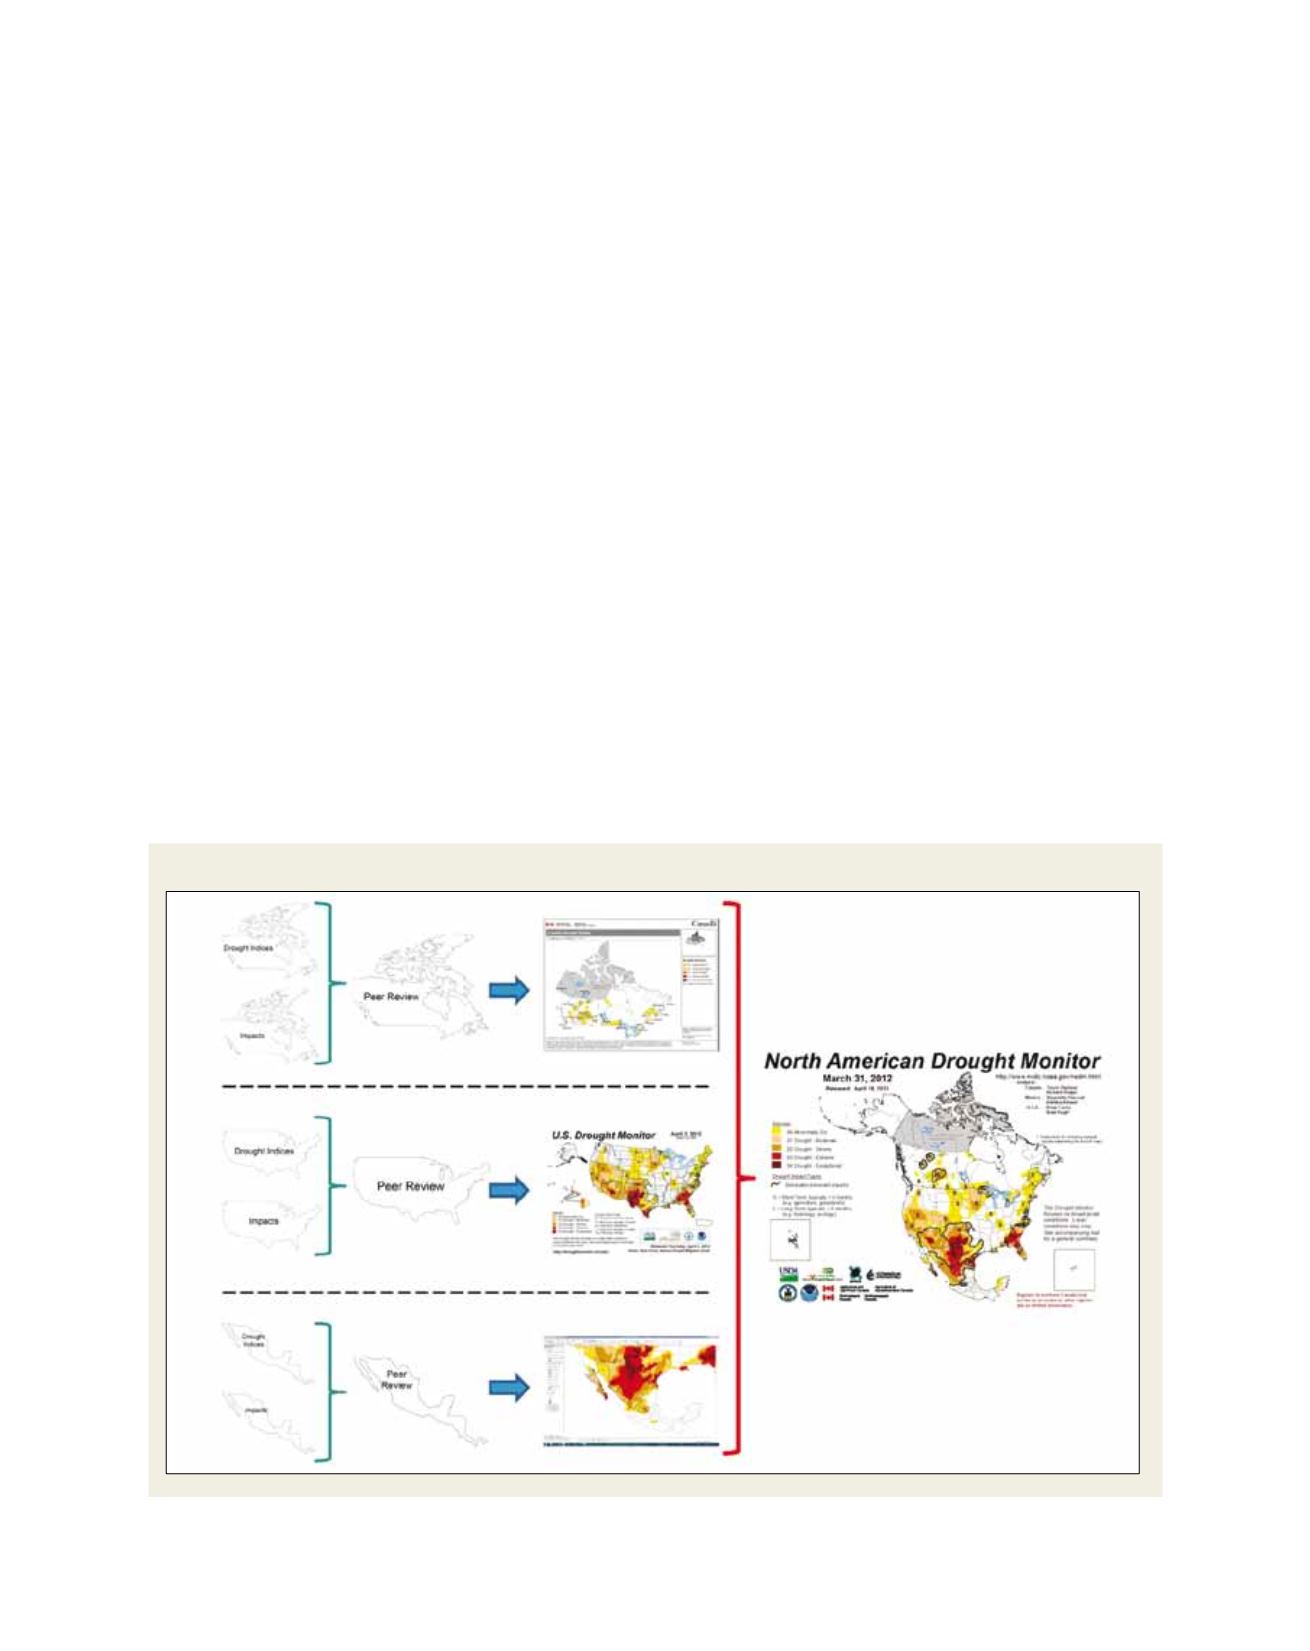
The USDM is used for the US drought depiction. It is produced on a
weekly basis by NOAA, USDA and NDMC partners from a large suite
of in situ and satellite-based objective drought indicators (includ-
ing the Standardized Precipitation Index (SPI), Palmer Drought
Index, streamflow, mountain snow pack, precipitation percentiles,
modelled soil moisture, Vegetation Drought Response Index and
many others), impacts information (such as reduced agricultural
production), and local field input from over 300 participants. The
indices and indicators are combined using a simple D0-D4 scheme
and a percentile ranking methodology to address both short-term
and long-term drought. The USDM undergoes a peer-review process
through an e-mail based discussion list each week during its prepa-
ration, to ensure that the weekly drought depiction represents the
best ‘blended convergence of evidence’.
15
The weekly USDM map
from the week closest to the end of the month is used for the US
depiction on the NADM map for that month. The national Drought
Monitors (DMs) for Canada (by AAFC) and Mexico (by SMN) are
prepared in a similar manner.
Each of the three countries provides daily and/or monthly temper-
ature and precipitation data to the NCDC for the computation of
monthly station and climate division-based continental drought
indices (SPI, Palmer Drought Index, and percentage of long-term
average precipitation). These continental drought indices, computed
using the same methodology and calibration periods, are used by
the lead author in conjunction with other drought indicators with
North American coverage (such as the NOAA satellite-derived
Vegetative Health Index and continental scale modelled soil mois-
ture), as guidance to prepare a consistent NADM drought depiction
along the international borders. The NADM continental
map and narrative are provided to the partner agen-
cies and organizations for an iterative peer review. The
NADM map is finalized, generally, by the tenth day of
the month and put online by the NCDC by the elev-
enth and the NADM narrative is placed online a few
days later. The NADM map GIS shape files are available
online (restricted access), and the NADM is available
at no cost on both a static website
16
and via the NIDIS
drought portal.
17
Both the NADM map and narrative
are provided in the languages of the three countries
(English, French and Spanish). The continental drought
indicators are also available at the website in both map
format and ASCII data files.
Policy decisions are made at the top management level
of the partner agencies and organizations and are guided
by bilateral and trilateral agreements. Operational,
technical, administrative, scientific and user issues are
addressed and evaluated at biennial NADM Forumwork-
shops hosted, on a rotating basis, by the three countries.
These workshops provide a mechanism for valuable
feedback, whereby users may express their drought
monitoring needs to the NADM authors (resulting in
improvements to the NADM product) and receive guid-
ance on the appropriate use and interpretation of the
NADM. Common user concerns expressed at NADM and
USDM forums include appropriate ways to use the DM
products and indices in their decision-making processes,
The flow of production of the NADM
Source: NOAA