


 232 / 288

[
] 233
C
ommunities
marketing representative provided a valuable training
session on how to conduct effective and neutral inter-
views. Using RCSM to conduct these interviews had a
side benefit of helping to strengthen stakeholder rela-
tions in the regions.
The online survey (Stage 3) provided clear detail
on the demographics of the user group. The majority
of respondents were from the agricultural (46 per
cent) or national resource management (13 per cent)
sectors; male (73 per cent); university educated (58
per cent); and 45 years or older (56 per cent). When
asked why they used the site, the majority used it for
planting and cropping (25 per cent), business plan-
ning (24 per cent), general interest (18 per cent) and
risk management (9 per cent). These results reveal a
concentration of older males in the user group; this
might reflect the unique demographics of both the
dominant sector user group (agriculture) and the
tendency for there to be fewer women in manage-
ment roles.
What the SCO means to users
This project highlighted how important the SCO is to
users. This was reflected in the high response rate to the
survey; in user eagerness to participate in workshops
and interviews; and in the level of effort, thought and
detail of user contributions at all stages of the consulta-
tion. The market research consultants advised that user
Stage 2: Interviews with 10 high-level external SCO users
High profile experts in key stakeholder groups such as emergency
services and agriculture provided their views on short-term and
strategic needs. This input helped ensure that the mass-user online
survey was targeted towards the key issues. The project team strove
to achieve some gender balance through deliberately seeking some
senior female users; two were found.
Stage 3: Online survey of mass user group
Members of the group of 961 respondents were quizzed about
their experiences of the SCO. Qualitative information was captured
through open-ended questions, for example: “How satisfied are you
with the Seasonal Climate Outlook?” “Why do you say that?” “How
can it be improved?” Quantitative information was gained through
testing respondents to see if they interpreted the maps correctly.
For example, users were provided with a statement about an SCO
map such as: “It will rain across less than 40 per cent of north-
ern Queensland” and asked to respond with: “true”, “false”, “don’t
know” or “don’t understand”.
Stage 4: User-workshop
–
12 representative users
At this workshop, users were presented a very wide range of alterna-
tive design concepts (over 40 designs) and asked for feedback. This
helped to create a ‘short list’ of preferred design concepts.
Stage 5: User-testing
–
interviews with 37 users across regional locations
Regional Climate Service Managers (RCSMs) in each state
conducted the final set of interviews. To assist them, the project’s
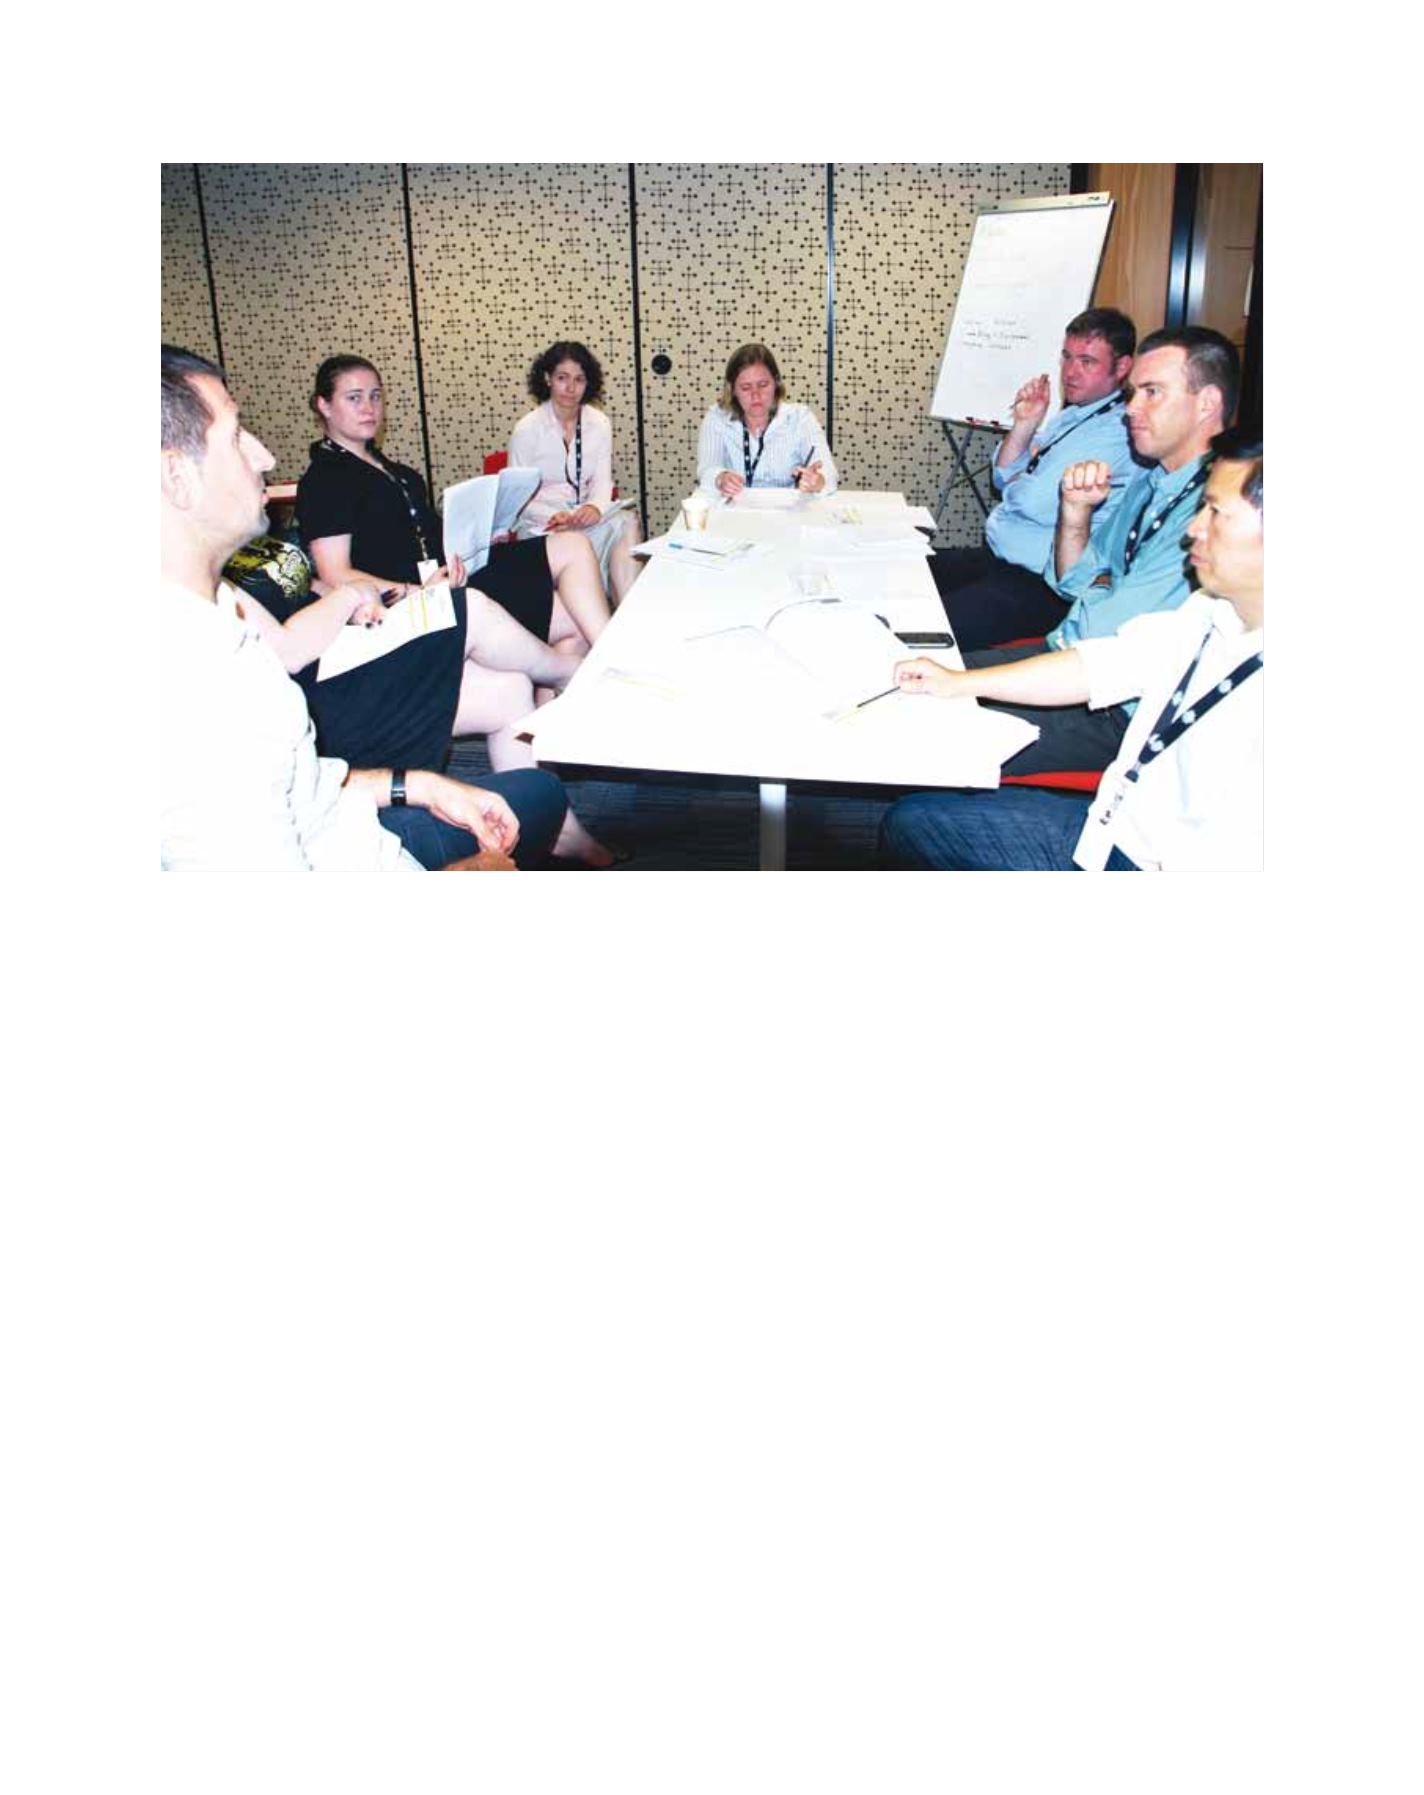
National Climate Centre staff considering stakeholder engagement plans
Image: Australian Bureau of Meteorology