


 71 / 288

[
] 72
Climate change impact on
Indonesian fisheries
Jonson Lumban Gaol and Bisman Nababan, Department of Marine Science and Technology,
Faculty of Fisheries and Marine Science, Bogor Agricultural University; Khairul Amri and Aryo Hanggono,
Institute of Fisheries and Marine Affairs for Research and Development, Department of Fisheries and
Marine Affairs; and Orbita Roswintiarti, National Institute of Aeronautics and Space, Indonesia
I
ndonesia is one the largest archipelago countries in the
world with total coastline exceeding 81,000 km and 5.8
million square metres of ocean. Indonesia is also the third-
largest producer of captured fish in the world.
1
Therefore,
fishery activities are economically and socially important in
Indonesia. However, these activities start to decrease as a result
of climate changes (weather uncertainty, extreme weather,
increase of sea surface temperature (SST), decrease in oceanic
primary productivity, changes in speed and direction of winds)
and increasing fuel oil prices. Climate changes will also affect
the distribution and abundance of fish in the sea, while the
increase of fuel oil prices makes fishermen more reluctant to
go sailing for fish. These factors cause fishing activities and
productivity to slow down.
The global warming that occurred in the last three decades was
caused by an increased concentration of greenhouse gases (GHGs)
in the atmosphere such as CO
2
, NO
2
, and CH
4
.
2
Compared with
the SST annual average for 1951-1980, the annual average global
SST has increased significantly, from about 0.1° C in 1981 to about
0.5° C in 2009.
3
This rise was concomitant with the increase of
GHG concentration in the atmosphere, especially in the last three
decades.
4
If there is no significant reduction of greenhouse gas
emissions, some models have predicted a rise in global surface
temperature in 2100 of 2.1-4.6° C, compared to the global surface
A
griculture
temperature in 1990.
5
Based on the measurements of
CO
2
at Mauna Loa, Hawaii and the South Pole, CO
2
concentrations continue to increase, from about 315
parts per million by volume (ppmv) in 1959 to about
385 ppmv in 2008.
6
This indicates an increase in the
concentration of CO
2
in the atmosphere of about 1.4
ppmv every year over the last 50 years. The increasing
trend of CO
2
concentration in Mauna Loa and the South
Pole was also obtained in near-linear fashion.
7
Global warming as a causal factor of climate change
has a strong impact on marine living resources and
environments. Many studies indicate that climate vari-
ability and change have influenced marine fisheries.
8
The descending trend of fisheries productivity due
to global warming forces us to take urgent adaptation
measures in response to opportunities and threats for
food and livelihood provision. These include data and
information on ocean conditions and fish resources in
order to ensure sustainable fisheries management and
food safety assurance.
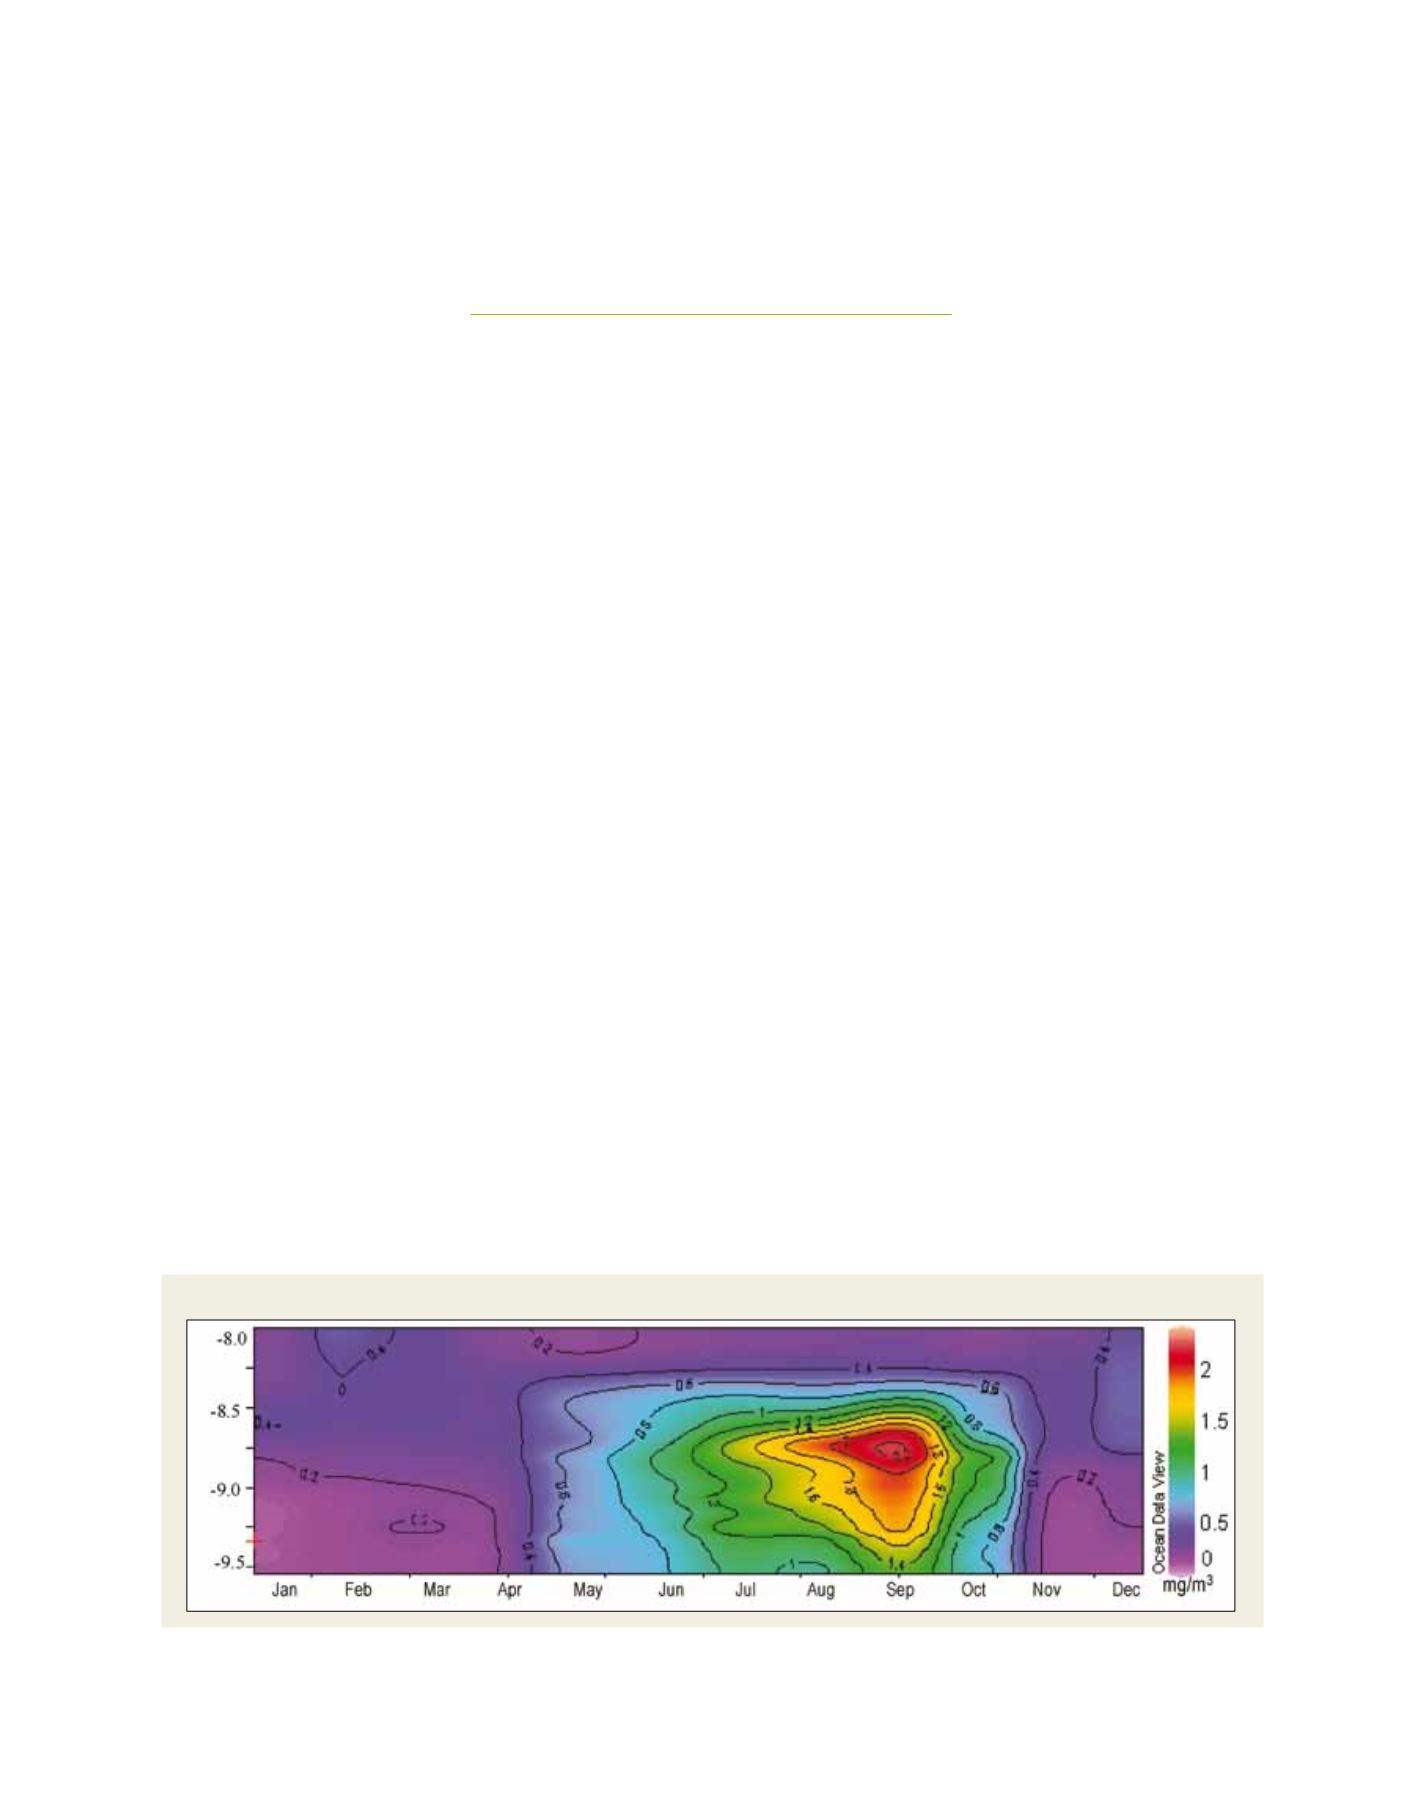
SST and chl-a concentration
Data for SST and chlorophyll-a (chl-a) concentrations in
Indonesian waters in the last two decades were analysed
to study their variability and trends. Monthly average
Source: Department of Marine Science and Technology, Bogor Agricultural University
A time-latitude plot of chl-a concentration in the Bali Strait (January-December)