


 72 / 288

[
] 73
A
griculture
Variability of oceanographic parameters and
fisheries production
The oceanographic parameters of Indonesian waters
were affected by monsoon wind, ENSO, and IODM.
15
During southeast monsoon between May and August,
the wind blows from the southeast towards the north-
west along the southern coast of Java-Bali-Nusa
Tenggara (eastern Indian Ocean or EIO), causing
water masses along the coast to be pushed away from
the coast, and producing seasonal upwelling within the
regions. The upwelling process brings deep-water mass
with nutrient-rich cold water to the surface, and that
affects thermocline layer shallowing and increases the
fertility of waters. Time series data from the SeaWiFS
in the Bali Strait upwelling region clearly indicated the
increase in chl-a concentration due to the upwelling
process, which begins in May and peaks in September
in this area.
Bigeye tuna (Thunnus obesus) was mostly caught in
the layer of 10-15° C isotherm, because this layer is suit-
able for the species.
16
Time series data for the catch rate
(hook rate or HR) of bigeye tuna over 15 years showed
that during the upwelling period, the bigeye tuna HR
generally increased.
Generally, the long line hook used to catch bigeye
tuna varied in depth from 100-250 metres. At the time
of upwelling, the 10-15° C isotherm was about 50
metres shallower than normal, resulting in a growing
number of hooks reaching the bigeye tuna fishing
layer – hence the increased hook rate. At the time of
upwelling, phytoplankton abundance also increased,
resulting in an abundance of small pelagic fish as a food
source for bigeye tuna.
The climate change impacts of ENSO and IODM are
seemingly anomalous from SST and chl-a concentra-
tions in 1994, 1997-1998 and 2006-2007. During ENSO
and IODM positive periods, more intense upwelling
occurs, the thermocline layer becomes shallower and
chl-a concentrations increase significantly in the EIO.
SST data from January 1982 to December 2009 and chl-a concentra-
tion from January1998 to December 2011 were obtained from the
National Oceanic and Atmospheric Administration and the National
Aeronautics and Space Administration websites.
9
In general, SST values in Indonesian waters varied from 25° C
to 31° C. Relatively high SST values were encountered during the
May-July period (summer), while the November-January period
(winter) showed relatively low values. The SST pattern was heavily
influenced by seasonal wind conditions such as the monsoon
winds.
10
During the northwest monsoon (November-February),
relatively cold winds and high moisture from the South China Sea
will lead to high rainfall and lower SST in the Indonesian region.
In contrast, during the southeast monsoon (May-August), the flow
of wind from mainland Australia carries little moisture and leads
to a relatively high SST with little rainfall (dry season).
11
The El
Niño Southern Oscillation (ENSO) and Indian Ocean Dipole Mode
(IODM) also influenced the inter-annual variability of SST in
Indonesian waters.
12
Some specific waters such as the Java Sea and Makassar Strait
had slightly different SST patterns. Relatively high SST values were
commonly found in October-December and March-May, while
relatively low values were seen in July-September and in January-
February. The Bali Strait and Arafura seas had different SST patterns
from other locations, with a maximum SST in November-March
and minimum SST in May-October. These patterns demonstrated
that the SST fluctuations in the Bali Strait, Arafura Sea, Java Sea and
Makassar Strait were influenced by monsoon winds and by the ocean
circulation in this area.
13
In general, the SST trend at various locations in Indonesian waters
over the last two decades has tended to increase. Over the same
period, it has tended to decrease in the Indian Ocean south of Java,
the Bali Strait and Arafura Sea. This may be due to an intensified
upwelling phenomenon in these regions.
In contrast to SST, the pattern of chl-a concentration tended to
decrease in general, except in the Indian Ocean south of Java, the
Bali Strait and Arafura Seas where intensified upwelling was evident.
Climate warming has reduced vertical mixing since the water
column is stabilized by thermal stratification, decreasing nutrients
the in upper layer.
14
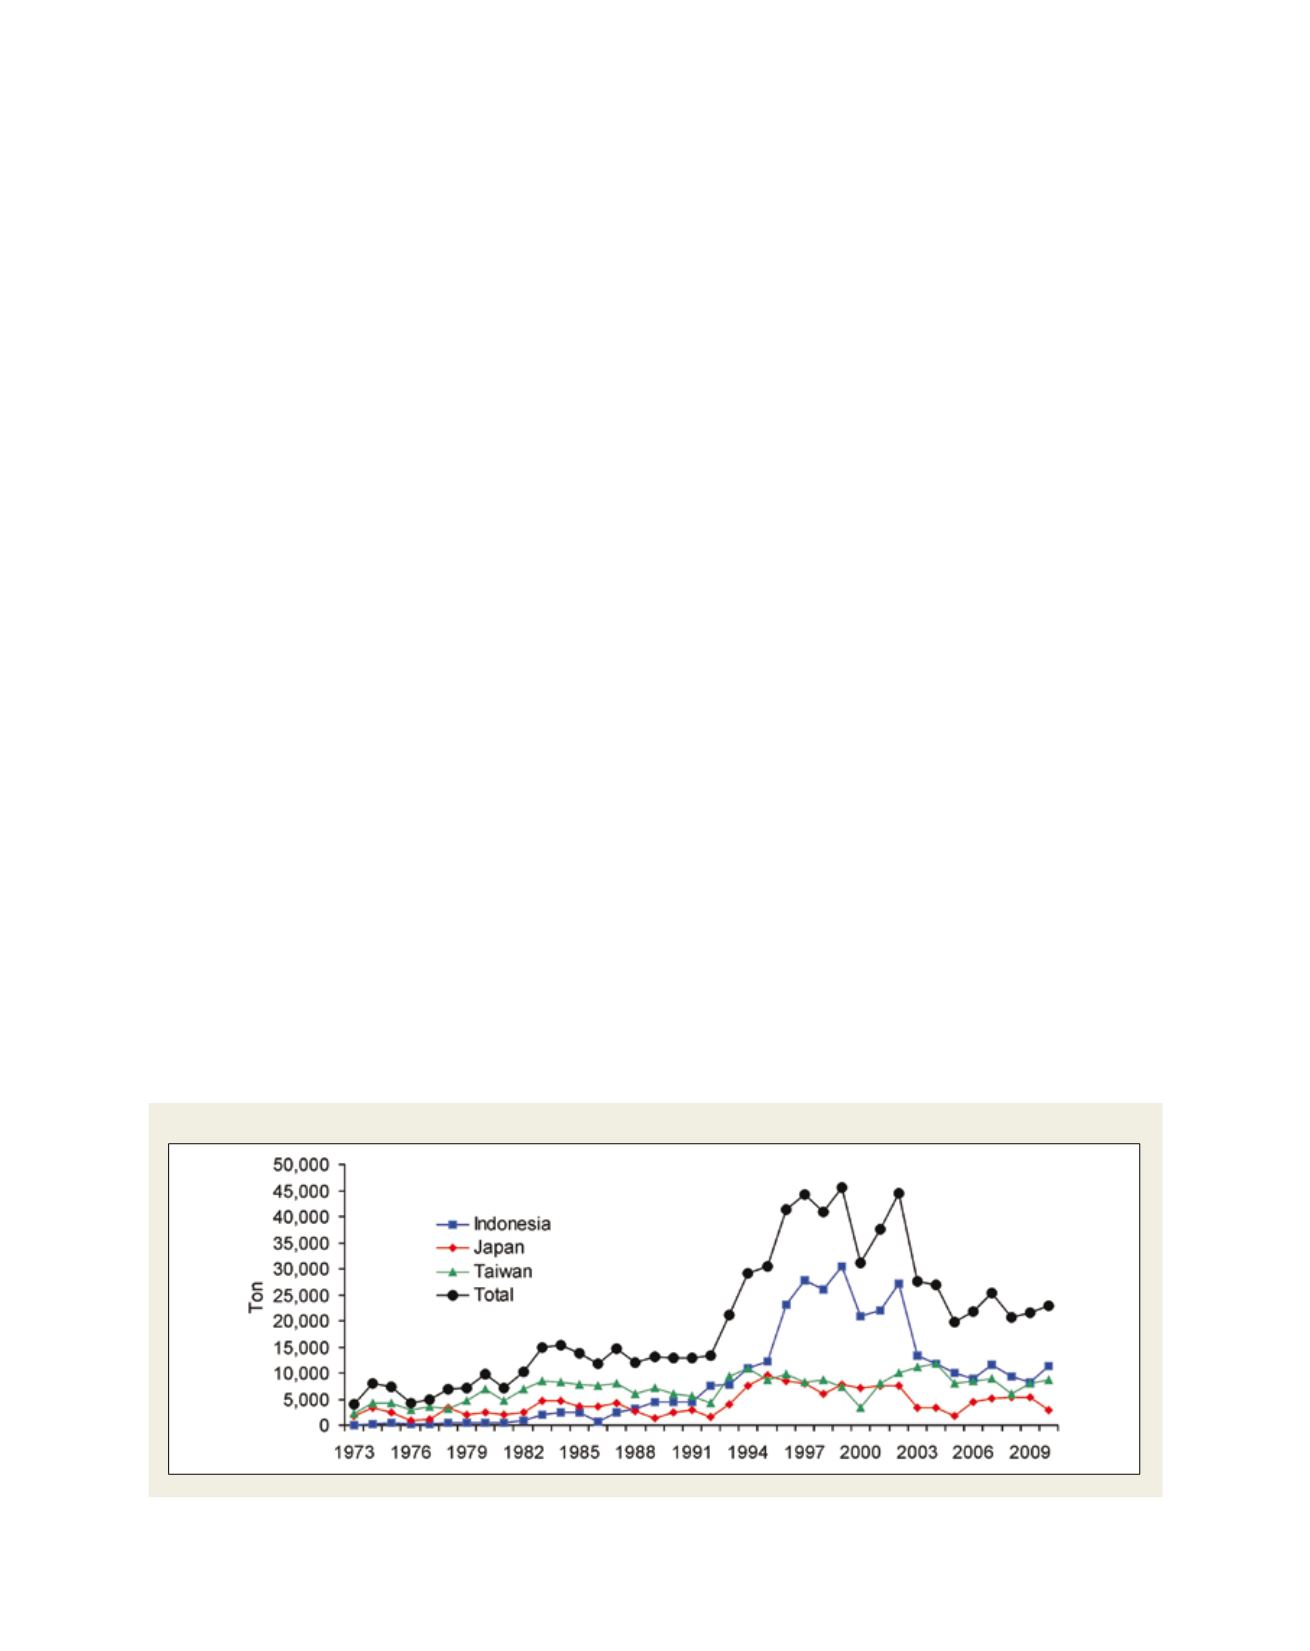
Source: IOTC, 2012
http://www.iotc.orgBigeye tuna production rates for Indonesia, Taiwan, and Japan in EIO, 1973-2010