


 146 / 287

[
] 147
O
bserving
, P
redicting
and
P
rOjecting
c
limate
c
OnditiOns
In hindcasts, the method predicts well the interan-
nual variability of storm numbers and ACE index.
Real-time forecasts since 2007 have also been
successful: 12 storms occurred in 2007 when the best
estimate prediction was ten, and 15 storms in 2008
when the best estimate prediction was 15.
Currently applications in the health sector are prob-
ably best developed for malaria prediction in Africa. In
malaria-prone regions incidence of the disease is posi-
tively correlated with seasonal rainfall totals. Research has
demonstrated the potential of using dynamical seasonal
predictions to predict malaria incidence in southern Africa.
Ensemble-mean November-February rainfall anomalies
from dynamical models of three centres participating
in the EU project DEMETER (Met Office, ECMWF and
Météo-France) show spatial distributions that are similar
to observed distributions when composited for years with
atures in the North Atlantic and northern European winter
climate, and later for the summers of 2007 and 2008, when tele-
connections between Europe and the tropical Pacific (in La Niña
phase) were invoked. In all these cases the ‘consolidated’ forecast
provided generally accurate guidance.
The cost of tropical storm damage represents one of the
largest risks covered by the insurance sector, and consequently
there is considerable interest in its long-lead prediction. Recent
research has shown that the skill of dynamical systems, such as
GloSea, for predicting the numbers of North Atlantic tropical
storms is comparable to that of statistical prediction methods,
which have traditionally formed the basis of most published
predictions. Based on research initiated at ECMWF and using
GloSea, the Met Office issues predictions of tropical storm
numbers and the accumulated cyclone energy (ACE) index
(a measure of the collective intensity and duration of storms)
during July-November.
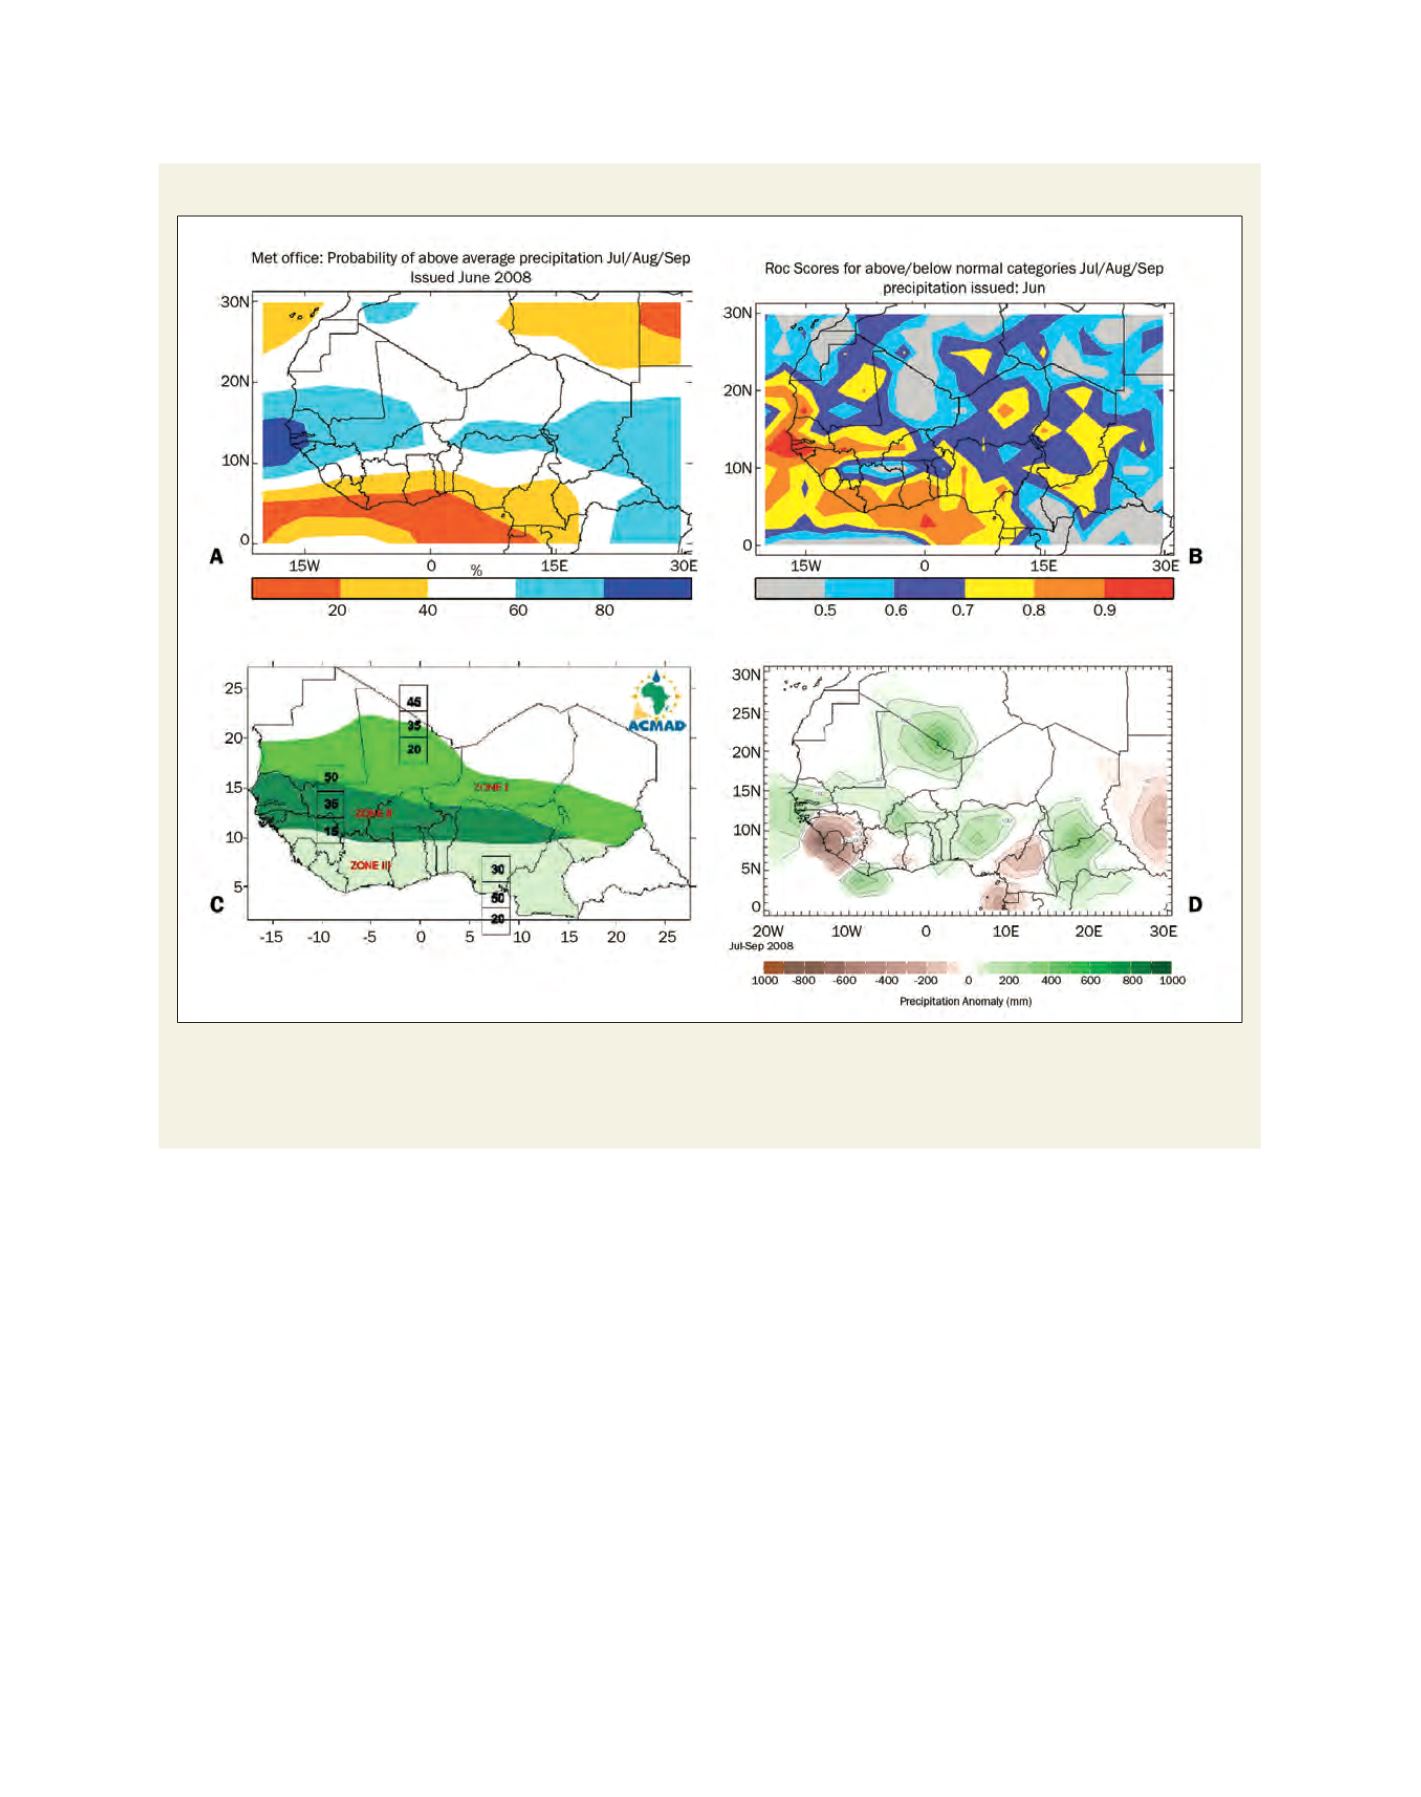
Predictions and observations for the 2008 wet season in West Africa
a) GloSea-predicted probability for rainfall above the 1987-2001 average, for JAS08 b) Prediction skill based on hindcasts for 1987-2001, scores greater
than 0.5 indicate forecasts are better than guesswork and perfect forecasts would attain a score of 1.0 c) PRESAO 11 consensus update forecast showing
predicted probabilities of (top to bottom) above-average, average, below-average rainfall for each geographical zone indicated by the colour shading. d)
observed JAS08 rainfall anomalies relative to 1979-2000
Source: a) and b) Met Office Hadley Centre, c) African Centre for Meteorological Applications for Development, d) International Research Institute for Climate and Society