


 120 / 208

Such an approach is new in Mongolia and important to ground-
level government policy, development strategies, governance and
business operation down to the rank of the households – a
primary unit of the society – and peoples’ livelihoods. Linking
a household with its surrounding natural and artificial environ-
ment will lead to an accountable relation between the head of a
family and public and private stakeholders.
Satellite remote sensing is a valuable information source, and
geographical information systems (GIS) embody a useful tech-
nology for working with digital maps. But they are not affordable
for the small county economies. Moreover, their technology is not
accessible to the public as it is very expensive and requires appro-
priate capacity building. In addition, transmitting and
downloading a large volume of digital images requires a high-
speed data network.
Database contents of the above mentioned two counties have
some specifics in complexity due to differences in climate, natural
environment, economic systems and administrative and territo-
rial units. The economy in Erdenedalai is based solely on the
livestock sector, while Mandal has forest areas, livestock, crop
and vegetation farms, mining, wood, urban and rural areas, a
well-developed infrastructure with paved and railroads. Therefore
the digital content of Mandal is more complex than the
Erdenedalai. The majority of Erdenedalai’s population are herders
who migrate with their animals, while the majority of Mandal’s
population are settled urban citizens and farmers.
Digital information flow is the lifeblood for making e-Soum
work. Technology provides tools to foster a well-integrated infor-
mation flow to the right people at the right time. In addition,
digital processes monitor, assess, predict and manage any
phenomenon and changes of a system and its environment, and
react appropriately to their impacts.
An example of digital information flow can be seen from the
risk manager system established at the Erdenedalai. It has three
directional data flows and provides coordinated action on the
information of 15 organizations (Figure 2). Top-down data
consists of daily, weekly and monthly weather predictions down-
scaled to and specified by different areas of the county territory,
warning messages for hazardous phenomenon, weekly maps of
pasture vegetation and temperature produced by using advanced
technology such as remote sensing and GIS. Bottom-up flow
provides informal data from the herders and farmers on air pres-
sure, temperature (measured by general equipment), extreme
meteorological phenomena that affect people and livestock,
households, and some data from county meteorological stations
and local government that is necessary for vulnerability studies
and risk assessment. Horizontal information flow helps to coor-
dinate the activities of different stakeholders in the county, namely
local government officers responsible for social insurance, agri-
culture, land and disaster management, bahg governors, the
county hospital, veterinary procedures, the meteorological station
and local FM radio.
Pilot projects that started in May 2005 to assist crop farmers
from the Tsagaannuur and Tushig counties in the province of
Selenge and in the Teshig county of the Bulgan province are to
provide more detailed information on weekly and long-term
[
] 120
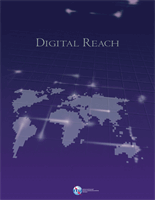
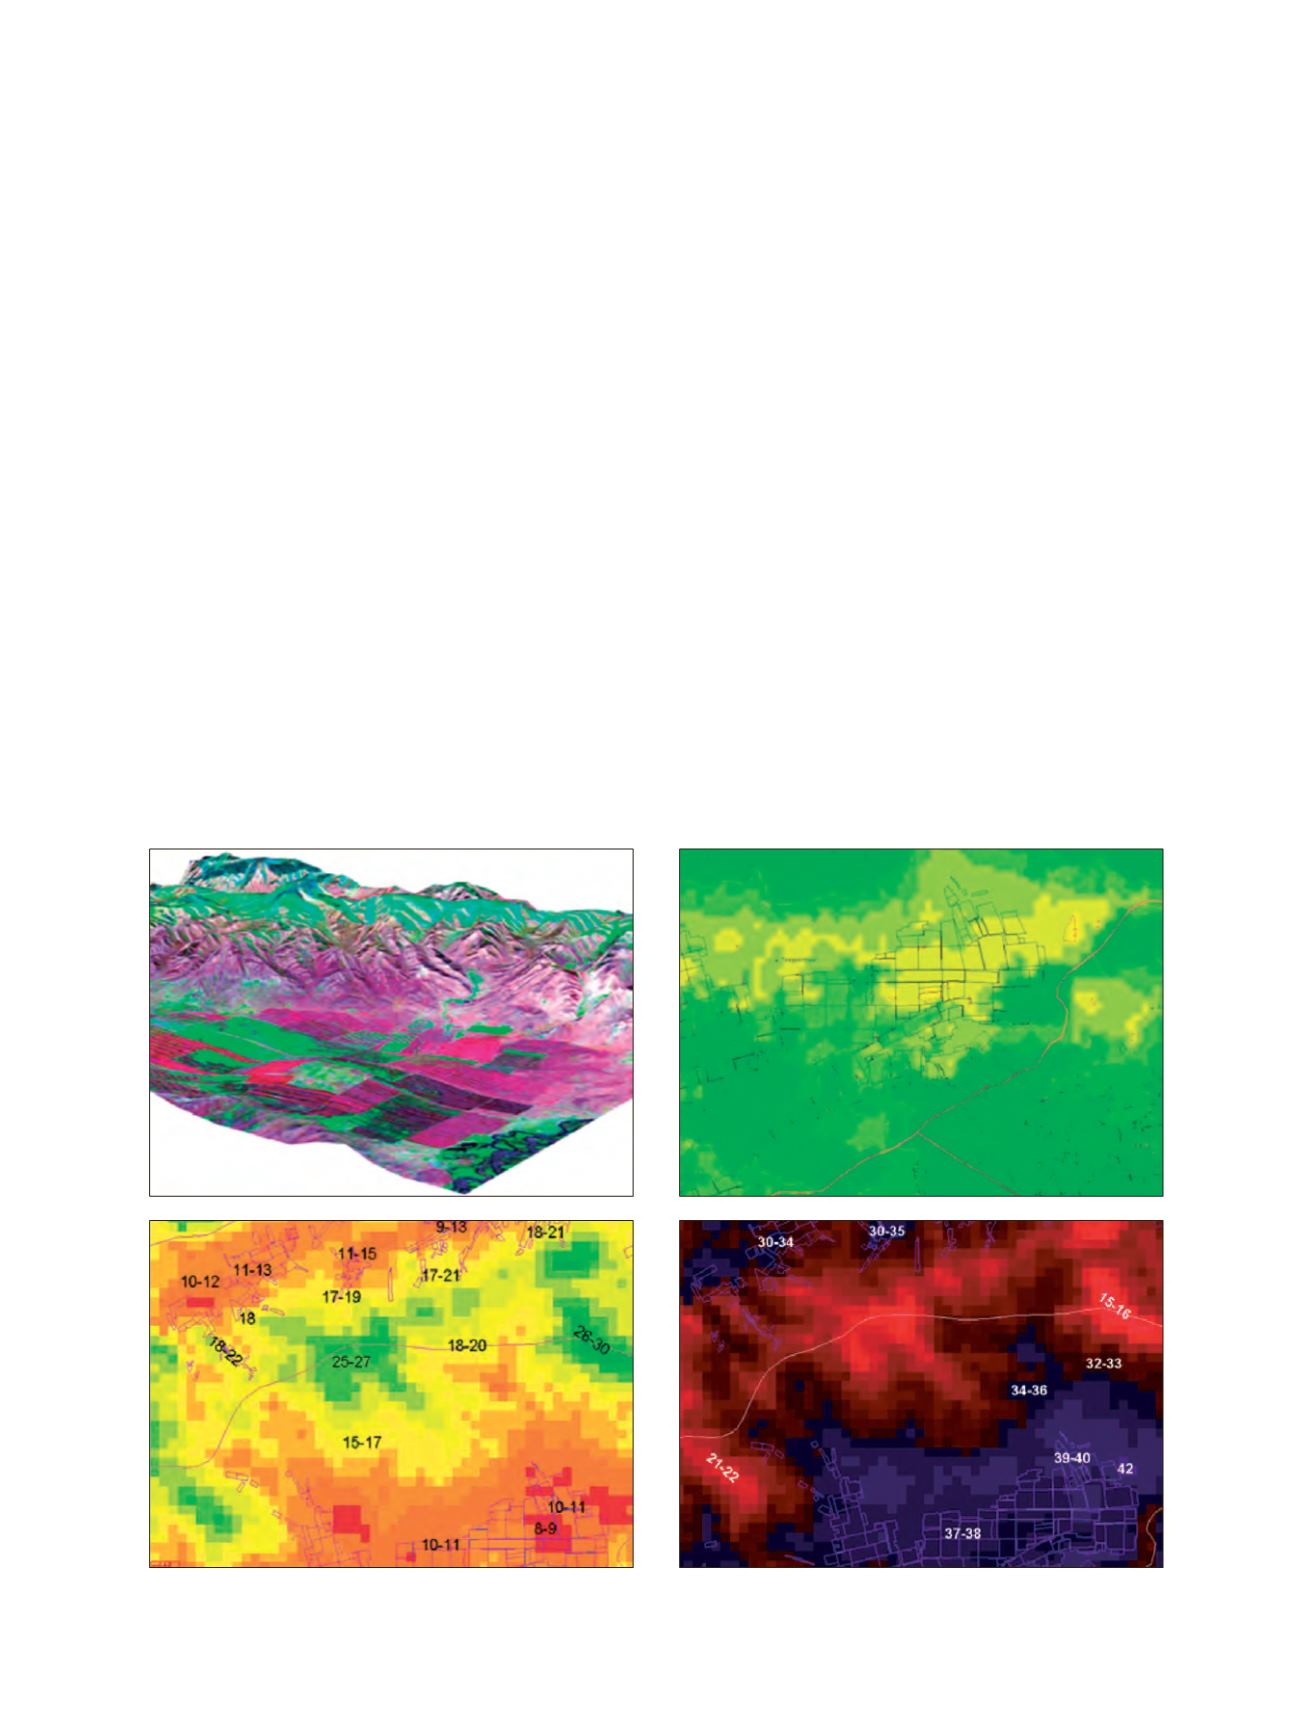
Figure 3: Spatial database for Tsagaannuur county
Land cover/use
Vegetation
Soil moisture
Temperature