
[
] 292
there is a need for projections of future human land use
to tackle this complex problem of foreseeing the forests.
Modelling forests
The structure of a simulation model for terrestrial
vegetation can be divided into two categories, a physics
module and a physiology module. The former deals with
heat and water budgets as well as microscopic meteoro-
logical processes near the surface. This module is often
treated separately as part of a land surface model and
incorporated in a climate model even when vegetation
dynamics is not explicitly taken into account, since the
above mentioned processes are so important for surface
climate. The latter module covers physiological and
ecological processes such as photosynthesis, stomatal
conductance (facility for gas exchange through the leaf
surface), respiration, leaf phenology, turnover of plant
and that projecting its future on time scales longer than a century
requires consideration of those interactions. This is why it is becom-
ing common to incorporate geographical dynamics for vegetation
into Earth system models (climate simulation models with biological
and chemical processes used to project how the global environment
changes as a result of human emission of greenhouse gases).
Another anthropogenic factor that has to be taken into account
is land use change (LUC) such as transformation from forest to
agricultural land or cities, or vice versa. Human pressure on natural
vegetation is rapidly growing and cropland now occupies a signif-
icant portion of the Earth’s surface. Carbon emission from LUC,
largely deforestation, is never negligible compared to that from fossil
fuel burning, and is the largest source of uncertainty for total anthro-
pogenic carbon emission. Human activities are posing considerable
constraints on vegetation dynamics, including the carbon cycle, and
there is no reason to believe that the constraints will diminish in
future. On top of the interactions between climate and vegetation,
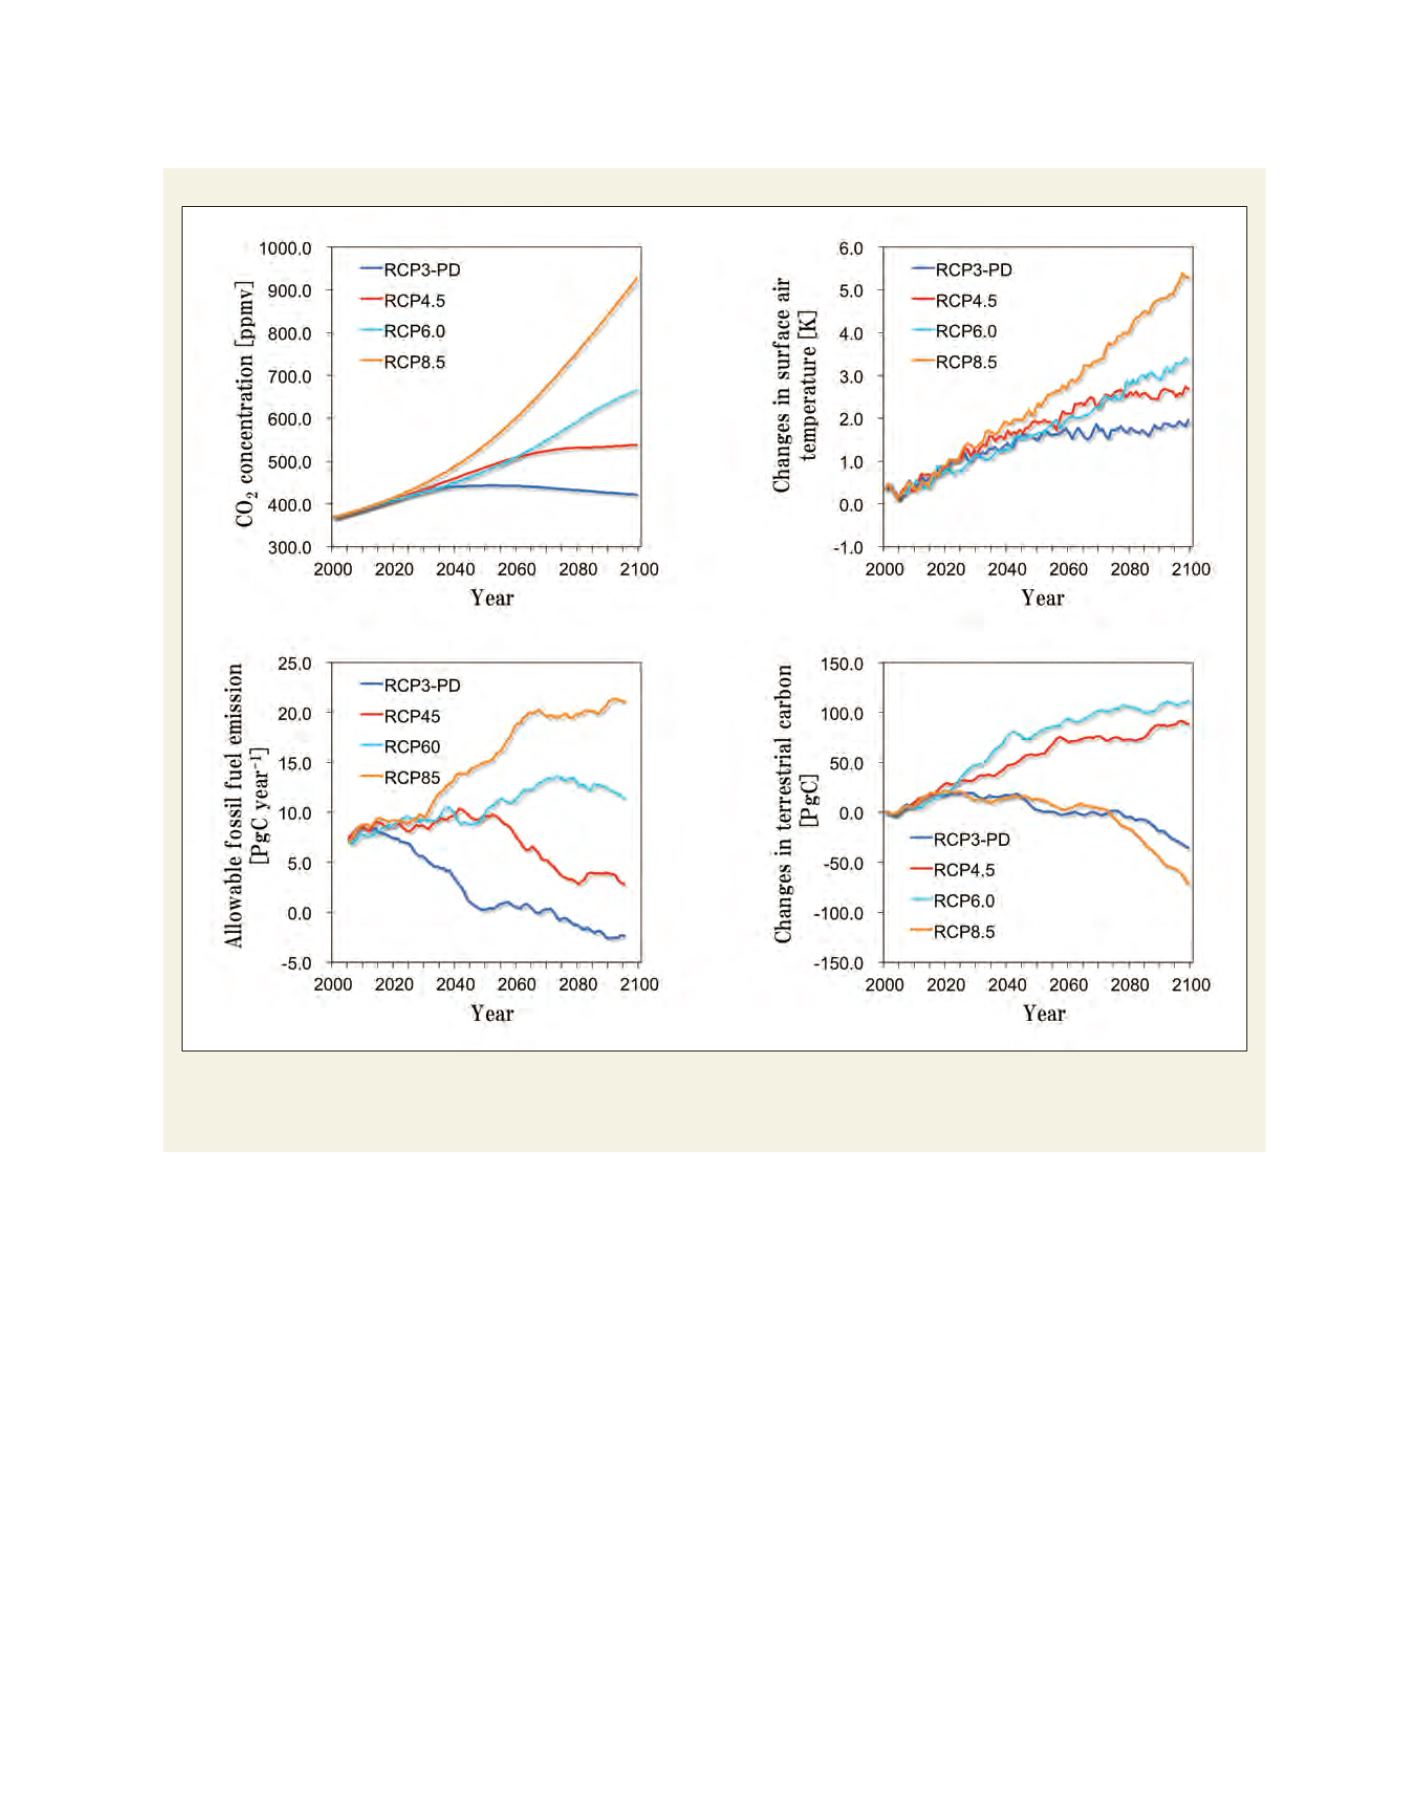
Global environment projections
Source: JAMSTEC/MEXT
Time series for (upper-left) CO
2
concentration scenarios, (upper-right) global mean temperature rise relative to mean for 1980-1999 simulated by MIROC-
ESM, (lower-left) CO
2
emission pathways required to achieve the concentrations in the upper-left panel, calculated based on MIROC-ESM simulation, and
(lower-right) changes in land carbon simulated by MIROC-ESM


