


 131 / 192

[
] 131
Satellite laser altimetry: a powerful tool to
enhance the capability of global forest inventory
Yoshiki Yamagata, Masato Hayashi and Habura Borjigin, National Institute
for Environmental Studies, Center for Global Environmental Research, Japan
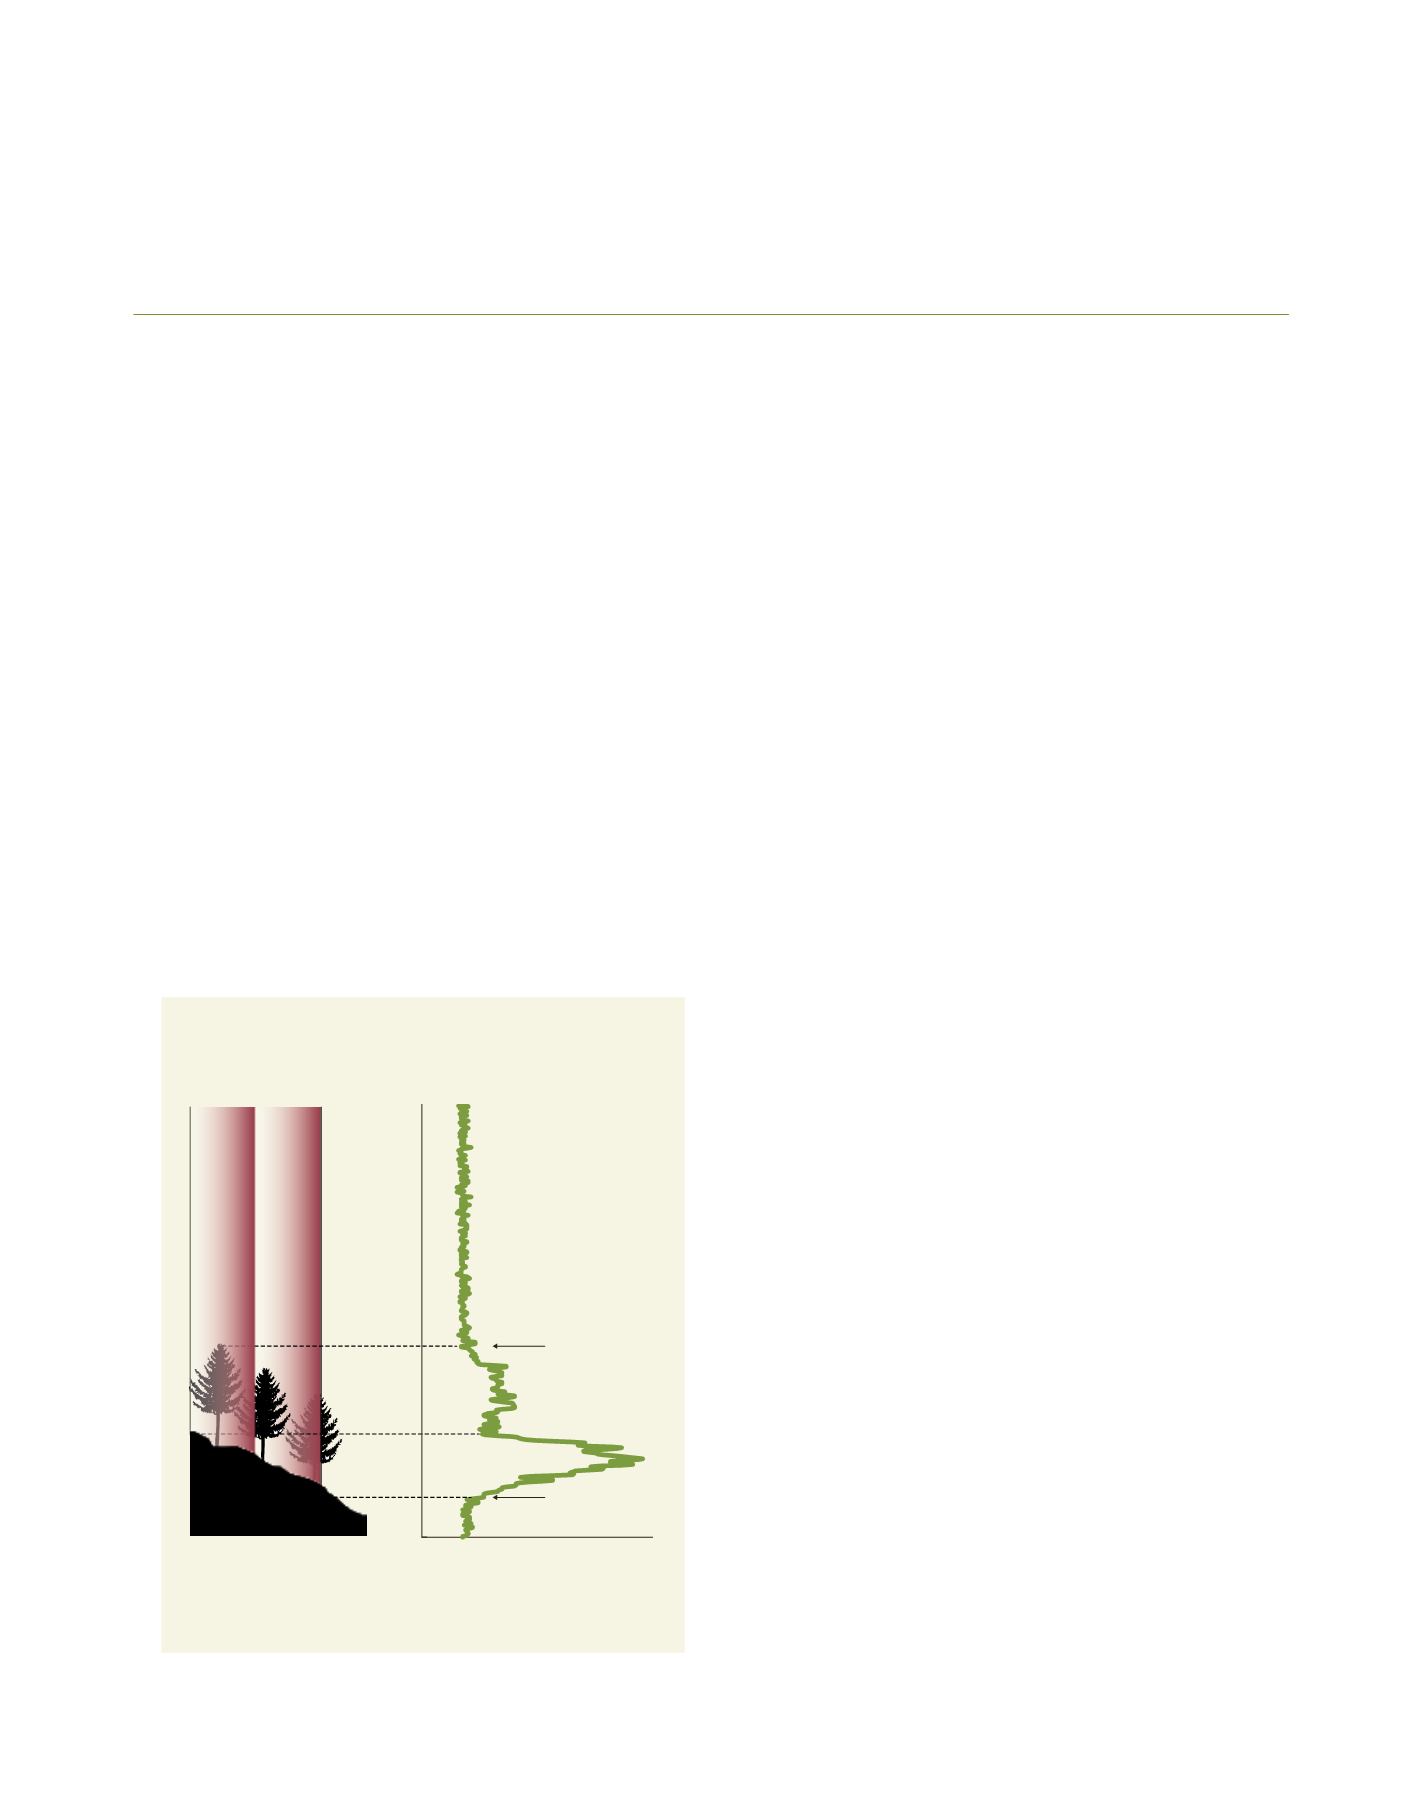
A schematic illustration of observations by
satellite laser altimetry
0
100
200
300
400
500
0
50
100 150
LiDAR Return
Signal end
Signal start
Source: CGER
G
lobal forest inventory is required for Reducing
Emissions from Deforestation and Forest
Degradation (REDD+) implementations. However,
conventional methods depending on field measurements are
extremely labour-intensive. Satellite laser altimetry can make
it possible to efficiently collect enormous measurement data
about forest carbon stocks without in-situ measurements. As
a result of verification in Borneo, laser altimetry was shown
to successfully and accurately measure canopy height and
forest biomass. Furthermore, laser altimetry could be used
to estimate the rate of forest loss, the distribution of forest
biomass, and the total amount of biomass in Borneo.
Among various ecosystem services of forests, the regulating
services such as carbon storage have attracted public atten-
tion, because they could contribute to mitigating climate
change. The REDD+ scheme has been developed in recent
years to prevent global warming resulting from deforestation.
Large-scale deforestation and forest degradation decreases the
water-holding capacity of soil, and it is one of the principal
causes of desertification. Therefore, REDD+ is also effec-
tive for combating desertification. The national report for
REDD+ implementations requires the measurement of activ-
ity data (extent of deforestation activities) and the emission
factor (greenhouse gas emissions per unit area). The emis-
sion factor is classified into three levels of complexity, from
Intergovernmental Panel on Climate Change default values
(Tier 1) to precise values based on a national forest inventory
(Tier 3). A higher tier can result in a more accurate carbon
budget estimation, but it may generally require labour-inten-
sive field measurements. Therefore, if satellite remote-sensing
can serve as a substitute or assistance for forest inventory,
it will be extremely valuable to REDD+ implementations by
reducing costs and labour.
For the estimation of forest carbon stocks using remote-
sensing technology, estimating forest biomass is usually
adopted as a substitute. Biomass represents the dry weight of
trees and about half of it is carbon weight. Therefore, forest
biomass can be easily converted into forest carbon stocks.
However, measuring belowground (root) biomass is difficult
for remote-sensing technology, so the aboveground biomass
(AGB) is usually adopted as a measuring object.
In remote-sensing technology, various sensors are used
on-board satellites. An optical imaging sensor is the most
orthodox sensor and has a long history; however, an accurate
estimation of forest biomass cannot be expected. Synthetic
aperture radar is a sensor using radio waves (microwaves) and
has an ability to measure forest biomass, but it has a weakness
in that the sensitivity is saturated in high-biomass forests over
150 t/ha. Laser altimetry, which is also called light detection
and ranging or LiDAR, is a sensor using laser beams, and it
can accurately measure forest biomass without signal satura-
tion. However, its weakness is that it cannot fully observe a
large area because its observation points are discrete.
The only satellite laser altimetry so far has been the Ice
Cloud and land Elevation Satellite (ICESat)/Geoscience Laser
Altimeter System (GLAS), operated by NASA from 2003 to
2009. GLAS transmitted laser pulses with a frequency of 40
Hz, and its footprints were spaced at intervals of 172 m on
the ground along ICESat’s orbital track. The footprint was
elliptical with a 60 m nominal diameter, but the size varied
according to the observation period. The GLAS observations
L
iving
L
and