


 152 / 192

[
] 152
Long-term drought in southern Australia
David Jones and Alex Evans, Australian Bureau of Meteorology
A
ustralia is the driest inhabited continent with
strong rainfall variability from year to year. Annual
mean rainfall averaged across the continent is 465
mm, but this has varied between a low of 314 mm during
1902 (an El Niño event) to 760 mm during 1974 (a La
Niña event). While rainfall is not strongly correlated from
year to year, a number of multi-year drought events have
occurred of varying spatial and temporal duration and
intensity including the federation drought (1896-1902),
Second World War drought (1937-1945) and more
recently the millennium drought (1997-2010).
Each of the multi-year drought episodes resulted in severe soci-
etal and economic impacts, with the loss of life through wildfires
and heatwaves. The first two of these multi-year droughts were
widespread in impact affecting the bulk of continental Australia,
whereas the millennium drought mostly impacted southern
Australia. While an estimate of the full cost of the millennium
drought is not available, extremely low rainfall during 2006 saw
the loss of an estimated $A7 billion in agricultural production
alone. Devastating wildfires occurred during the summer of
2002/03, 2006/07 and 2009 in forests which were tinder dry due
to drought and heat. The Black Saturday bushfires of 7 February
2009 resulted in 173 deaths and at least $A4.4billion in property
damage across south-east Australia, being one of the costliest
disasters in the country’s history.
While drought is an episodic feature of the Australian
climate, the most recent drought highlights a confluence of
climate variability (drought) and climate change (changing
aridity) and raises the question of how to define and manage
drought in a changing climate.
The millennium drought affected most of southern Australia
with particularly severe conditions experienced in the more
densely populated and cultivated south-east and south-west
regions. A feature of the millennium drought was the especially
marked decline of cool season rainfall in the south with little
reduction in the warm season rainfall in the south and excessive
summer rainfall in the tropical north. The cool season is the
main agricultural period across southern Australia. This meant
that irrigated agriculture reliant on winter inflows into dams
was badly affected across the south, as was winter grain produc-
tion in the southern cropping regions of Australia (annual grain
production is near 40 million tons). Impacts on ecosystems and
urban water supplies dependent on cool season replenishment
were also significant. In striking contrast northern Australia,
a region of low population density and lower intensity agri-
culture, saw above-average to record-high rainfall during the
summer half of the year.
The effect of below-average rainfall during the cool season
was accumulative in southern Australia, leading to increas-
ing hydrological impacts which compounded over the years.
This saw a long-term drying of vegetation and a drawdown
of surface and ground water resources. For example, in
Melbourne (a city of more than 4 million people) urban water
storages dropped from almost full in October 1996 (97.5 per
cent) to only one-third full by June 2010 (33 per cent). Water
supplies for this city would have been emptied at the peak
of the drought were it not for water restrictions and price
increases applied to water use in response to the drought
which curtailed consumption.
With the millennium drought affecting all major capital cities
across southern Australia, large-scale urban water projects were
commissioned, including the construction of desalination
plants in Perth, Adelaide, Melbourne, Sydney and Brisbane with
a total cost of more than $A10 billion. The trigger for supple-
mental water supplies was a lack of confidence in the past as a
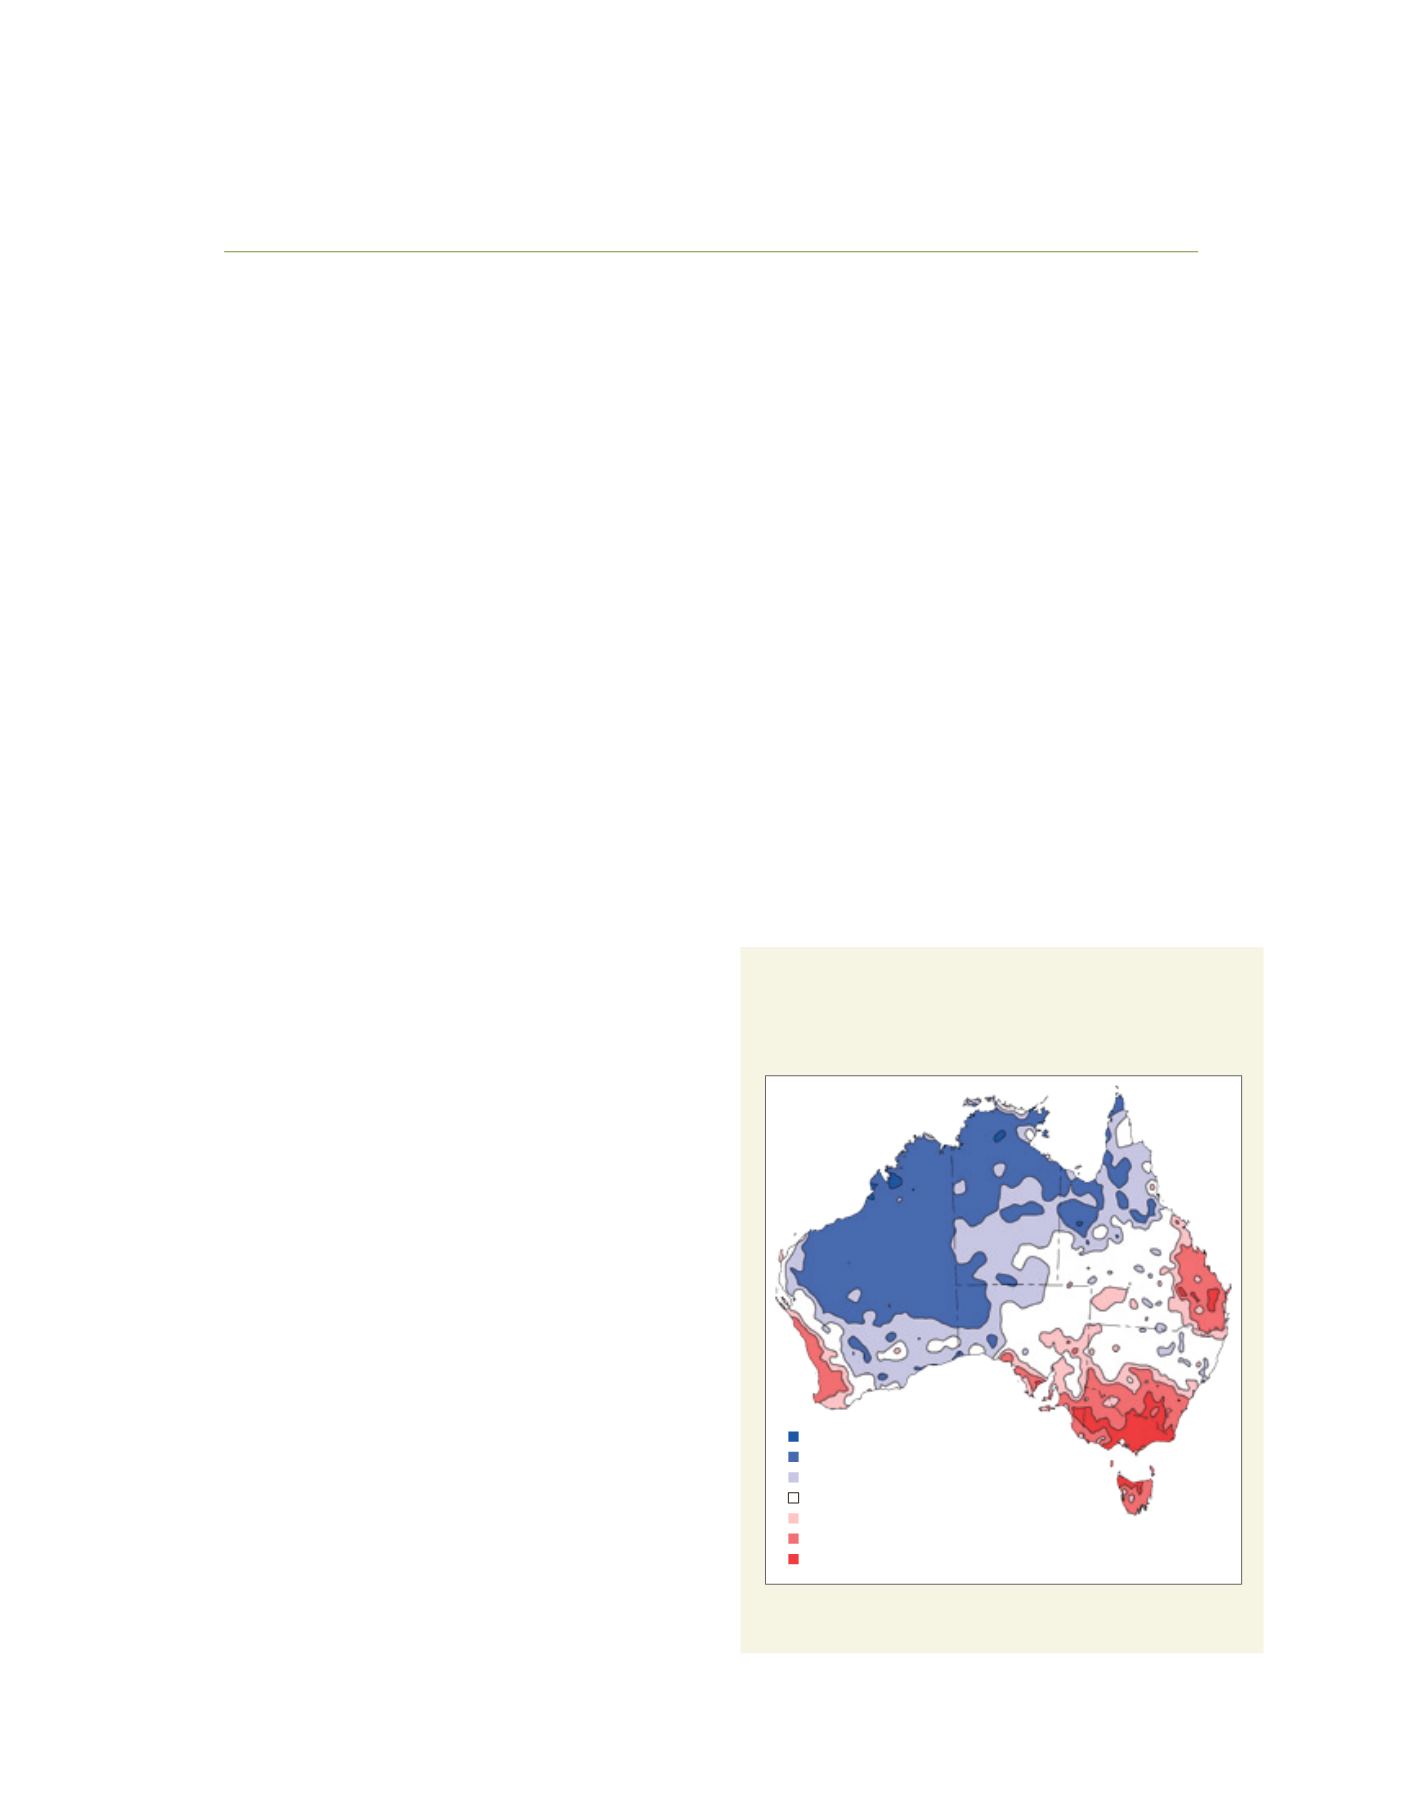
Rainfall deciles for the peak of the millennium
drought, calculated from national rainfall data
from 1900 to the present
Source: Australian Bureau of Meteorology
Above Average
Average
Very Much Above Average
Highest on Record
Lowest on Record
Very Much Below Average
Below Average
L
iving
L
and