


 153 / 192

[
] 153
guide to the future, and the very real fears for water supplies in
the event that the drought continued.
The distinctive feature of abnormally heavy warm season rain-
fall in the north and cool season rainfall deficits in the south
has no obvious parallel in the historical record, and is not easily
understood in terms of the dominant natural variability tied to
the El Niño Southern Oscillation. Past droughts tended to extend
across most of Australia and have a particular focus across the
eastern third of the country, where rainfall is reduced during El
Niño events. The millennium drought, however, manifests out
of strong seasonal rainfall across Australia, which also provides
insight into the proximate (‘local’) cause of the drought.
Rainfall in northern Australia is dominated by the summer
monsoon, with rain coming from storms, monsoonal lows and
the occasional tropical cyclone between November and April.
The cool season is virtually rain-free with high rates of evapo-
ration, low humidity and clear skies.
In southern Australian (south of about 35°S), most of the
annual total rainfall comes as a result of cold fronts and mid-
latitude (baroclinic) low pressure systems. These systems peak
between April and October (the cool season) when the lows
in the Southern Ocean tend to move closer to Australia as
the dominant belt of high pressure moves further north to be
placed over the Australian landmass. While summer rainfall
does occur, surface water balance is such that during the warm
months it contributes very little to water supplies for urban use,
and has very limited use for agricultural production.
Southern Australia sits on the northern limit of the mid-
latitude westerlies and is particularly susceptible to shifts in
the intensity and latitude of fronts, low and highs. Of particu-
lar importance is the dominant high pressure belt, known as
the Subtropical Ridge, which extends across central Australia
during the cool season. This high pressure belt is the cause of
the semi-arid and arid dry zones that occupy the subtropics
in both the northern and southern hemispheres. A poleward
shift in the high pressure belt and increases in its intensity
means dry zones expand further into the mid latitudes (and
vice versa). El Niño events are one factor that can drive an
expansion and intensification of the high pressure belt over
Australia, which is part of the reason for the droughts that
Australia commonly experiences during these events.
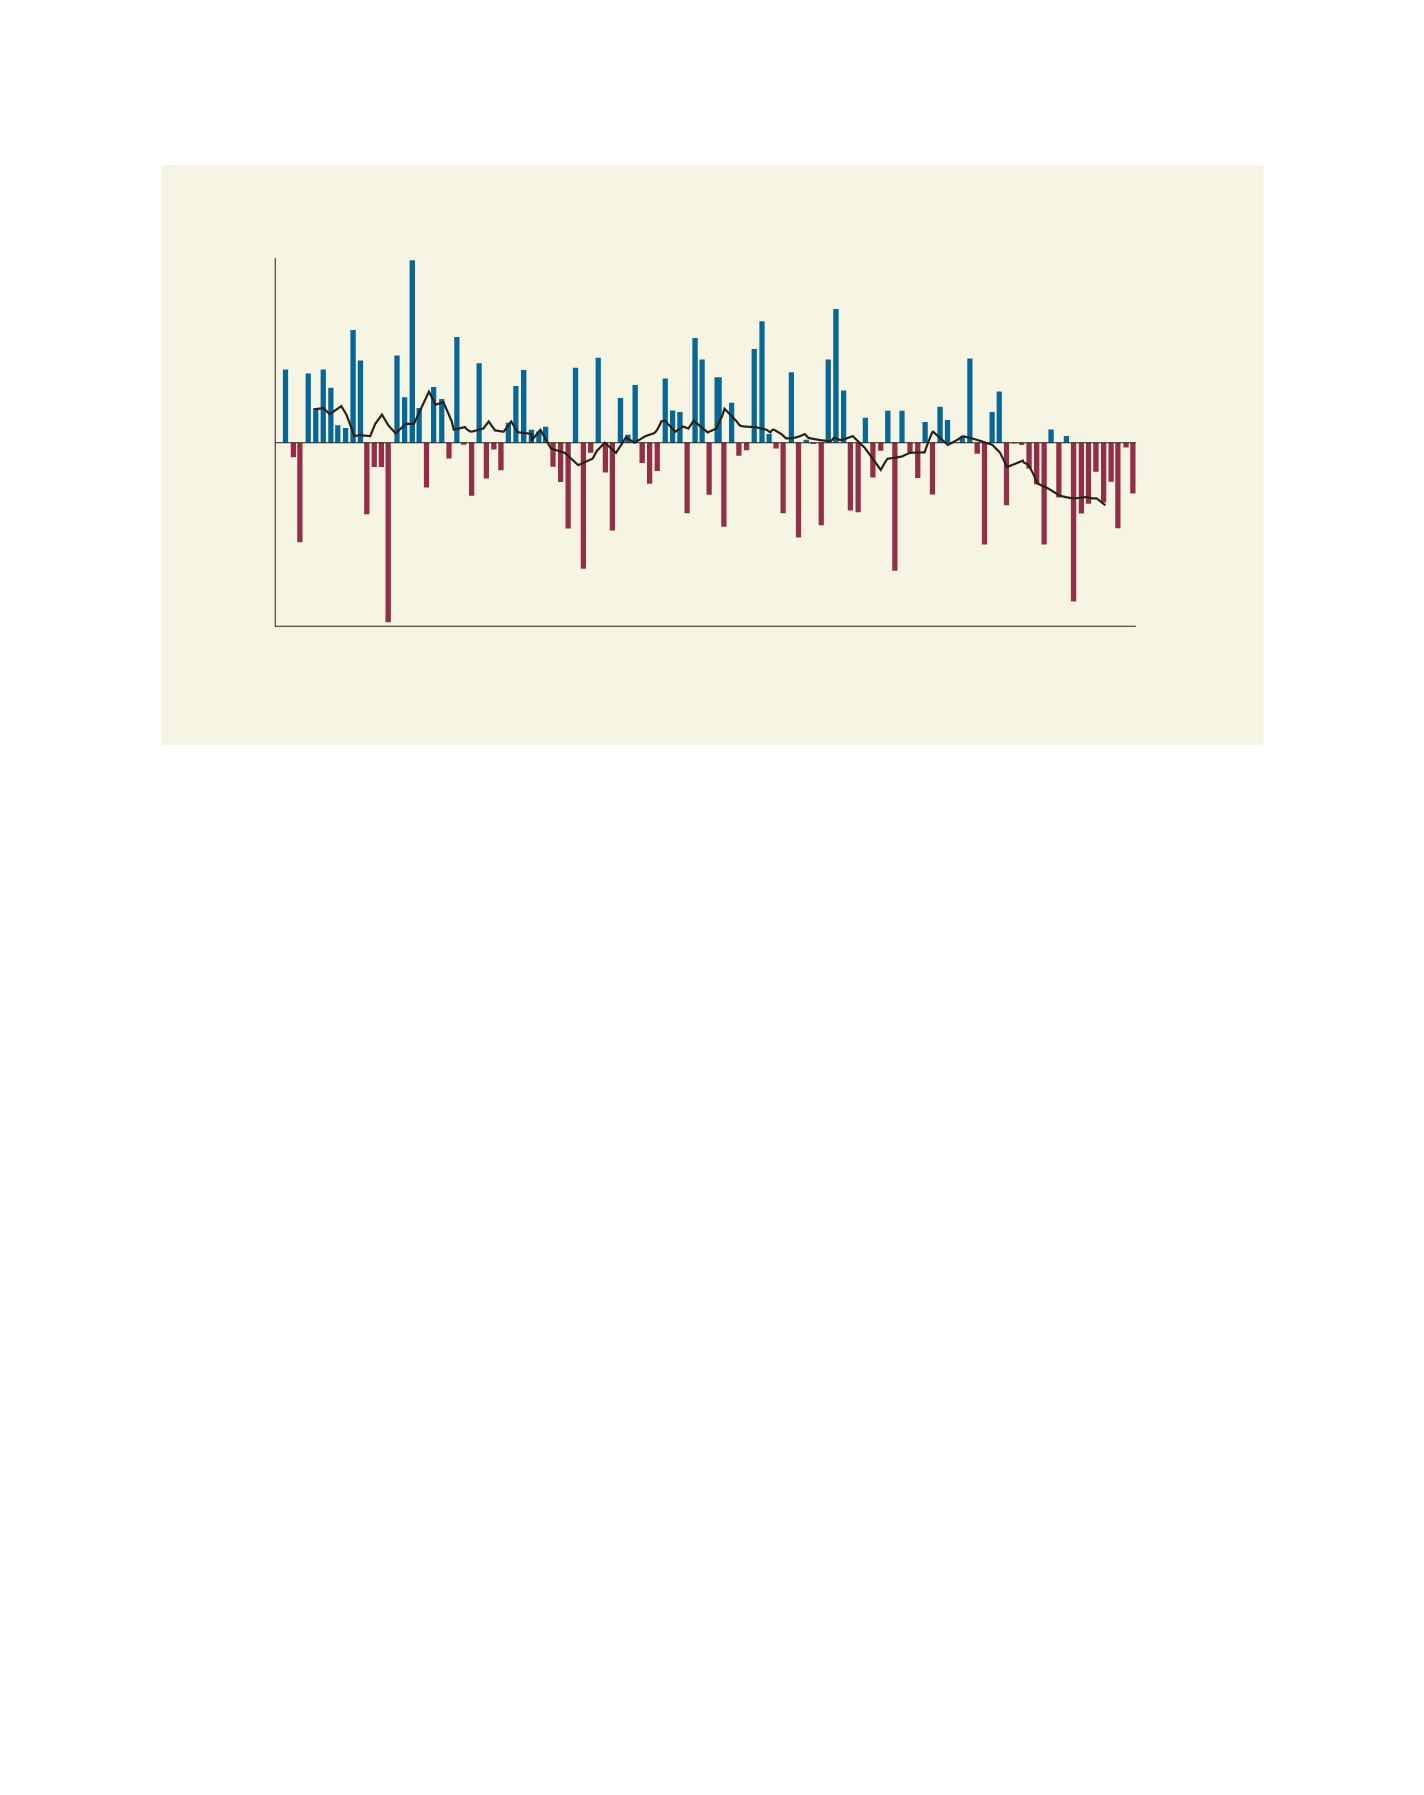
The April to October cool season rainfall across southern
Australia shows a systematic decline in recent decades that
is broadly consistent with climate change projections for the
region. The recent multi-year drought appears as a continu-
ation of lower rainfall which commenced in the 1970s. The
initial decline appears as a loss of very wet years and more
recently the near-complete dominance of below-average rain-
fall conditions year after year. During the past decade the mean
rainfall in this region is more than 15 per cent below average,
meaning the loss of more than 1.5 years of cool season rainfall
in total during the millennium drought. This anomaly is more
than twice as large as for any previous like period and up to
four times as large in some high rainfall catchments relevant
to urban water harvesting in southern Australia.
The recent decline in rainfall has coincided with increasing
atmospheric pressures between the months of April to October
and a subsequent decline in the penetration of fronts and lows
across southern Australia. The intensifying pressure means an
increasing dominance of dry weather as the subtropical ridge
has become more dominant. Atmospheric pressure across
Australia shows remarkably strong correlations with rainfall
and explains some 60 per cent of the year-to-year variability
(variance). The accumulated impact of the trend in pressure
implies a mean rainfall reduction of nearly 50 mm over the past
50 years. This figure is close to the anomalies which have been
observed during the millennium drought in southern Australia.
In other words, the proximate cause of the recent cool season
Cool season rainfall in south coastal Australia: the solid line shows the 10-year running anomaly
Source: Australian Bureau of Meteorology
Year
1900 1910 1920 1930 1940 1950 1960 1970 1980 1990 2000 2010
200
150
100
50
0
-50
-100
-150
-200
Rainfall Anomaly (mm)
L
iving
L
and