


 179 / 280

[
] 179
oceanic mesoscale field, coastal variability and marine geoid/bathym-
etry, surface water levels on land and their changes in space and time,
and surface topography of glaciers and ice sheets.
Conclusions
Sea-level rise during the 20th century was much faster than in the previ-
ous few centuries and millennia. In situ and satellite data indicate an
increase in the rate of rise since 1870, and that sea level is
currently rising at a faster rate than at any time during the
last 130 years. Sea level is projected to continue to rise at
an increasing rate during the 21st century and beyond.
Over the last several decades, including the period of
the IPCC projections since 1990, models indicate a slower
rate of sea-level rise than observed, thus raising concern
about the accuracy of projections for the 21st century and
beyond. Significant further work is required to under-
stand adequately 20th century sea-level rise and thus
improve projections for the future; a fundamental aspect
of that work is the need to sustain and enhance a suite of
ongoing satellite and in situ observing systems. To the
extent that we are able to sustain these observations,
research programmes utilizing the resulting data should
significantly reduce uncertainties of our understanding
of historical sea-level rise and thus narrow projections of
future sea-level rise.
There are significant regional variations in the rate of
sea-level rise. However, the current generation of climate
models does not yet provide robust projections of regional
patterns of sea-level rise. As a result, the global-averaged
sea-level rise should be considered for planning purposes,
with some allowance for a potentially larger contribution
as a result of the regional pattern of sea-level rise.
The impacts of sea-level rise are being felt now, they
will be felt during the 21st century and in the longer term
and society will need to adapt to the effects of these rising
sea levels. These effects include coastal inundation and
its consequences, and increased rates of coastal erosion.
Impacts will be felt most acutely during extreme events.
Coastal flooding events will become more severe and
events of a given height will occur more frequently;
indeed analysis to date indicates that there has already
been an increase in frequency of these flooding events.
The least developed countries and the poor are most at
risk. Adaptation requires local and regional planning to
avoid the impacts of the most severe events.
Amajor question is whether we will pass a critical point,
during the 21st century, that will lead to an ongoing and
possibly irretrievable melting of the Greenland or West
Antarctic ice sheet and a sea-level rise of several metres.
Our current understanding of ice-sheet dynamics is insuf-
ficient to predict whether any such large rise would occur
in a century or two or over many centuries or millennia.
Environmental refugees already exist as a result of
extreme sea-level events, and their numbers will increase
as a result of sea-level rise during the 21st century and
beyond. It is not a matter of if there will be major coastal
flooding events, but more a matter of when and where
these events will occur and how we will respond.
To address sea-level rise and its impacts requires part-
nerships between science, government, business and
community sectors. These partnerships are required now
and will need to be strengthened during the 21st century.
Appropriate strategies can lead to a significant ameliora-
tion of the impacts of sea-level rise through both
mitigation of our emissions and also plans to adapt to the
inevitable consequences of sea-level rise.
5
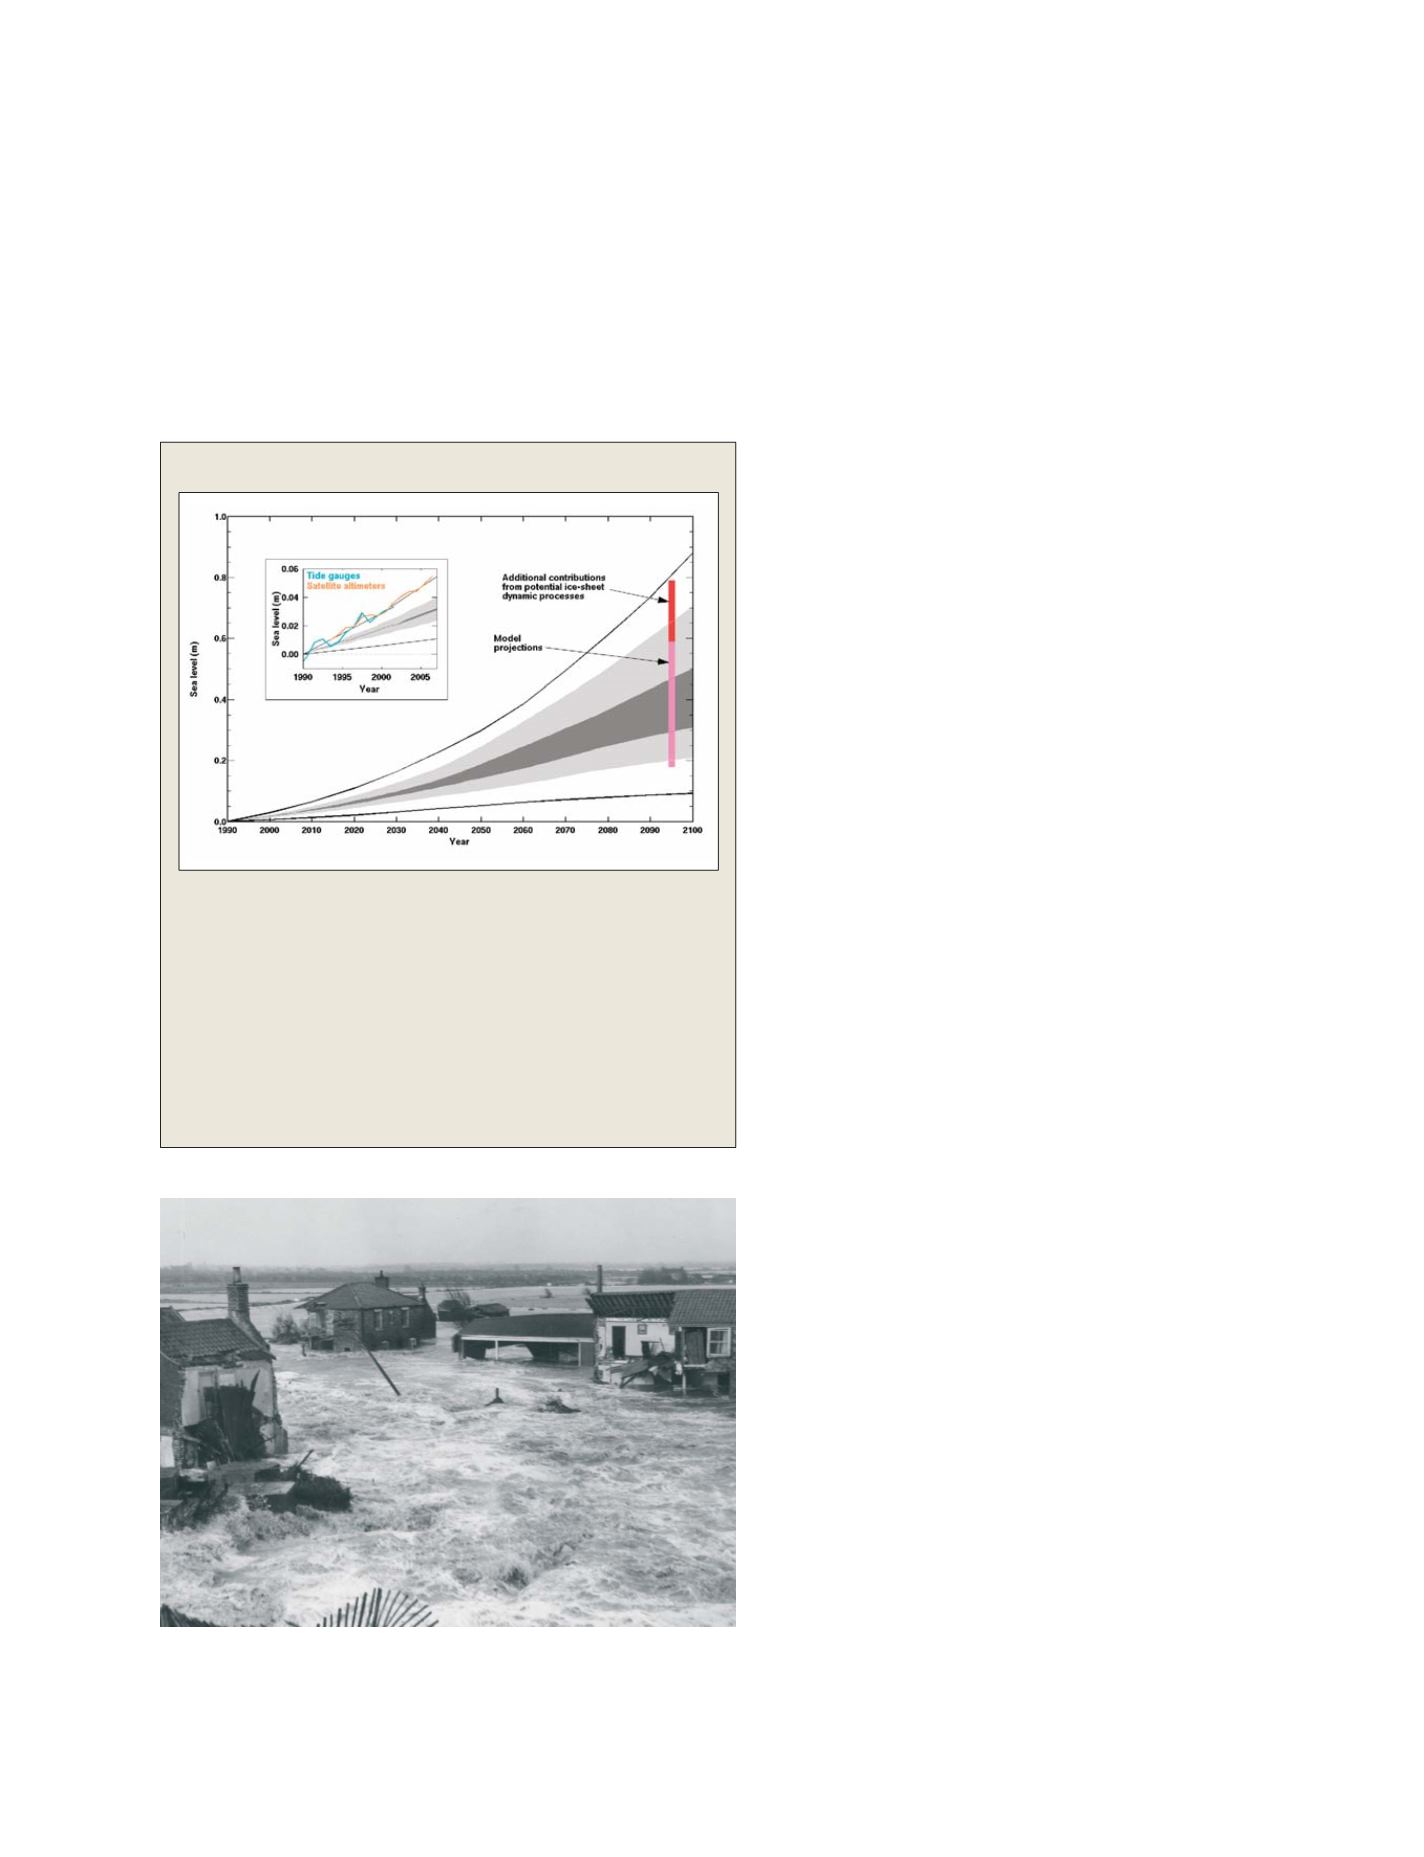
Projected sea-level rise for the 21st century
The projected range of global averaged sea-level rise from the IPCC 2001
Assessment Report for the period 1990 to 2100 is shown by the lines and
shading. The dark shading is the model average envelope for all SRES
greenhouse gas scenarios; the light shading is the envelope for all models and
all SRES Scenarios, and the outer lines include an allowance for an additional
land-ice uncertainty. The updated AR4 IPCC projections (90 per cent
confidence limits) made in 2007 are shown by the bars plotted at 2095 – the
magenta bar is the range of model projections and the red bar is the extended
range to allow for the potential but poorly quantified additional contribution
from a dynamic response of the Greenland and Antarctic ice sheets to global
warming. The inset shows the 2001 projection compared with the observed
rate estimated from tide gauges (blue) and satellite altimeters (orange)
The flooding at Sea Palling, Norfolk, UK due to the storm surge of 31 January –
1 February 1953. This storm surge resulted in major investment in coastal
protection along the east coast of the UK and in the Netherlands
Photo: Courtesy Eastern Daily Press
S
OCIETAL
B
ENEFIT
A
REAS
– D
ISASTERS