


 185 / 280

[
] 185
was first established. The use of remote sensing images
to monitor rainfall and vegetation was then proposed as
follows.
Monitoring rainfall
Using satellite rainfall estimate products updated every
ten days, IRI developed a Web-based Malaria Early
Warning System (MEWS) interface which enables the
user to gain a contextual perspective of the current rain-
fall season by comparing it to previous seasons.
The interface takes the form of an online ‘clickable
map’, which displays the most recent ten-day (dekadal)
rainfall map.
2
Dekadal rainfall can be spatially averaged over a
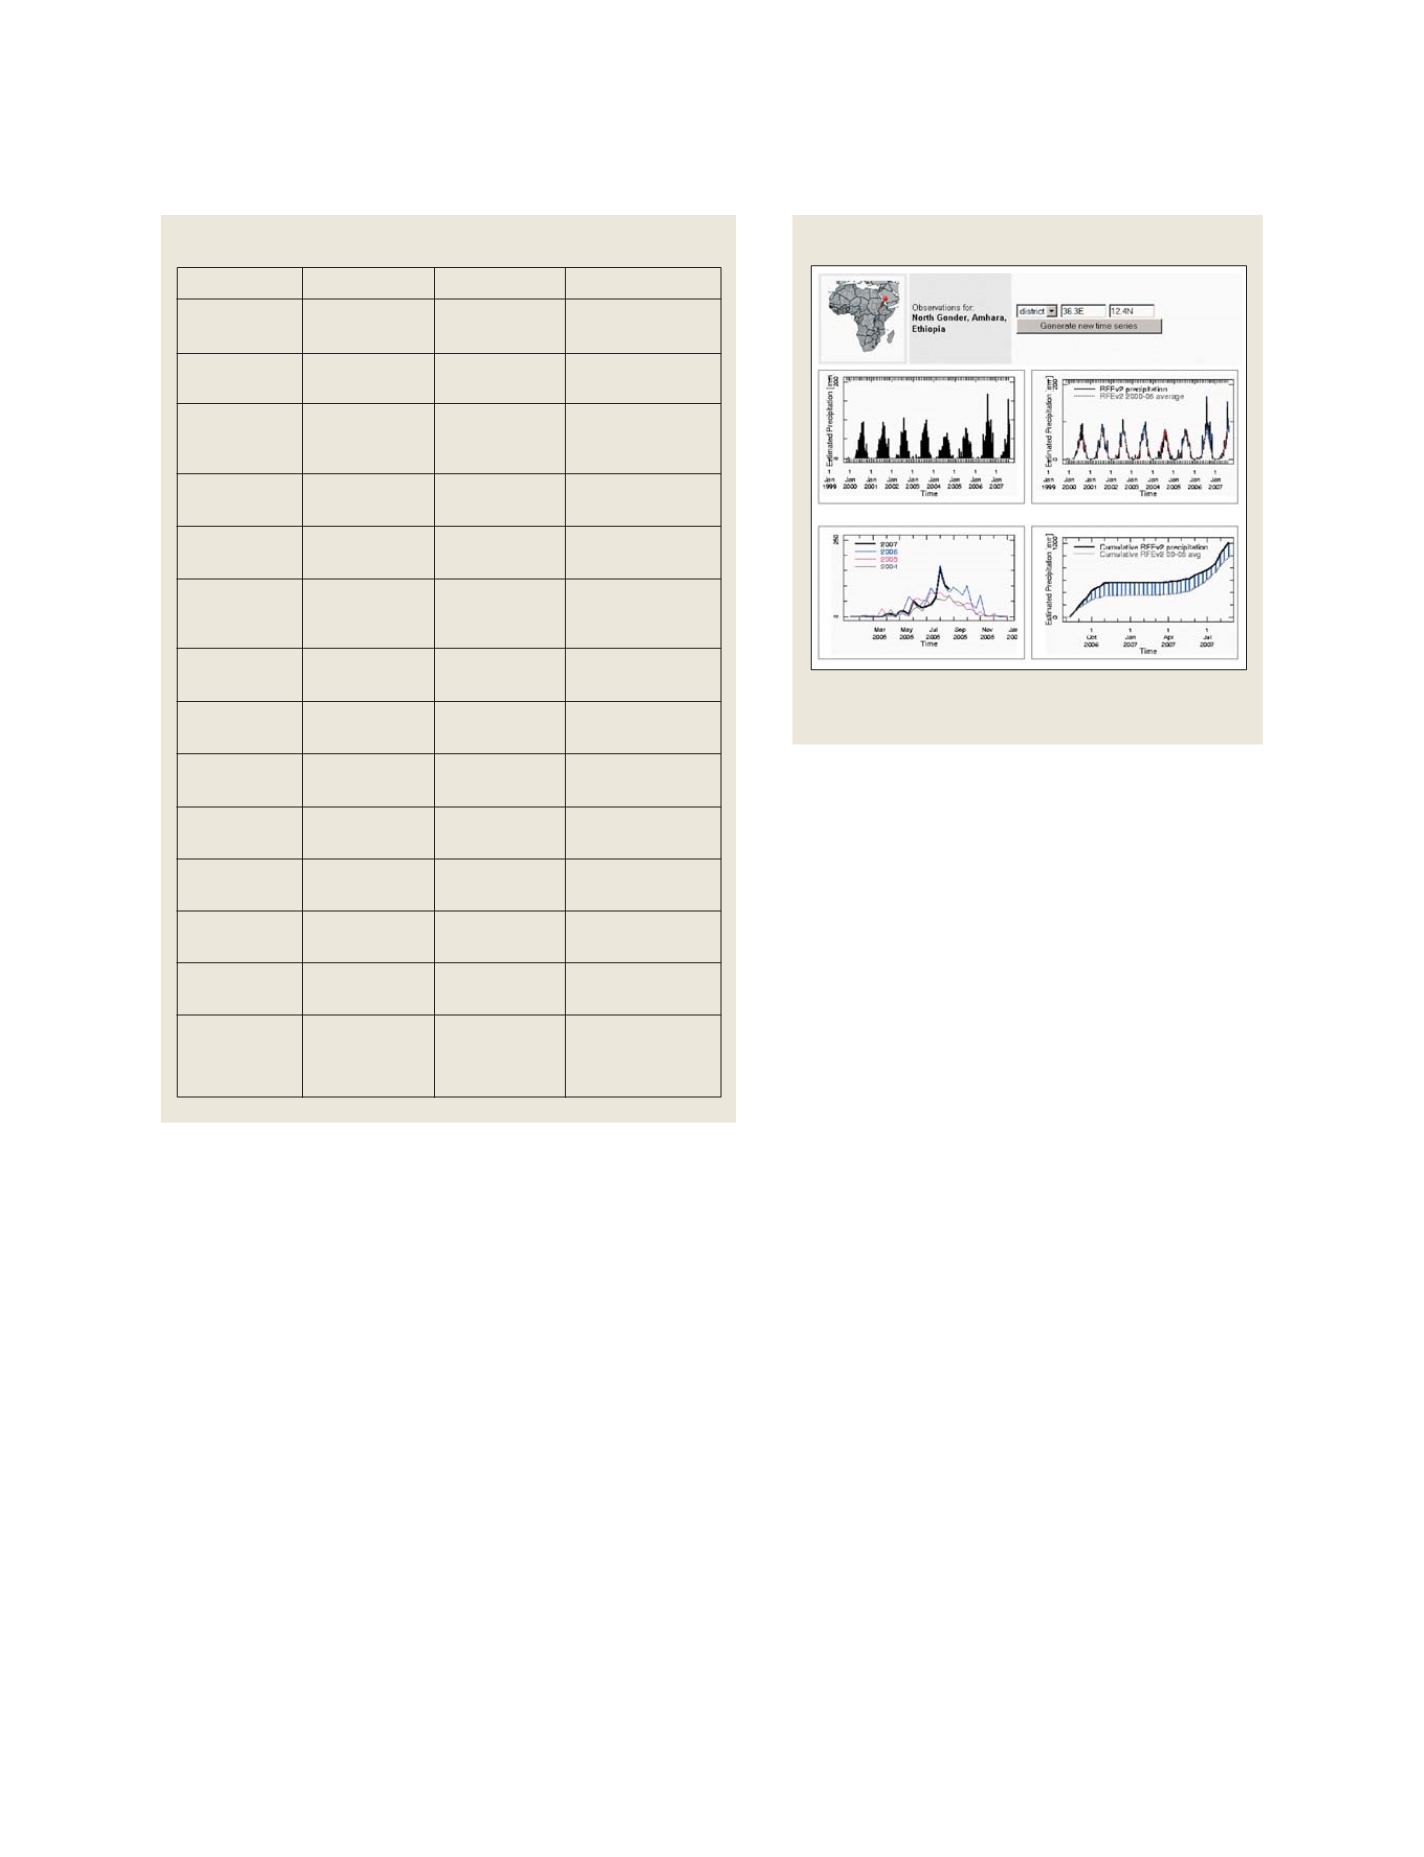
variety of user-selected areas. Upon the selection of this
sampling area and a specific location of interest (by
clicking on the map), four time-series graphs can be
generated. These graphs provide an analysis of recent
rainfall with respect to that of recent seasons and long-
time series.
These graphs allow the users to automatically see
whether the area of interest is wetter (blue colour) or
drier (red colour) than normal and decide whether risks
are associated with vector developments.
Monitoring vegetation and water bodies
In Eritrea, the relationship between the development of
vegetation and epidemics of Malaria has been established
in specific areas. The presence of surface water also
provides the habitat for the juvenile stages (egg, larvae
and pupae) of Malaria vectors.
To monitor vegetation and water bodies, TERRA-
MODIS images provided by the National Aeronautics
and Space Administration (NASA) are used. Frequent
images at high spatial resolution (250m) are made avail-
series of review papers. Yet, despite 30 years of successful research
on the potential applicability of remote sensing technologies to
control diseases, these tools are only now beginning to have an
impact on policy and practice in operational control of Malaria in
affected countries.
Operational use of remotely sensed images has taken a long time
to be implemented in technologically developing regions due to
prohibitive image and processing software costs. This problem is
now diminishing because of lower-cost computer processing and
data storage facilities, free access to high spatial resolution satellite
images via the Internet and the availability of processing tools such
as Healthmapper (Geographical Information System tool) to the user
community at no cost by organizations such as WHO. The recent
availability of free images and processing tools has enabled the rapid
development of applications using remote sensing and GIS for oper-
ational purposes.
The International Research Institute for Climate and Society (IRI)
has developed operational tools for Botswana and Eritrea. Using
Malaria cases from health facilities in both countries, the relation-
ship between rainfall, vegetation development and Malaria epidemic
Diseases
Malaria
African
Trypanosomiasis
Leishmaniasis
Yellow Fever
Cholera
Meningitis
Dengue
Rift Valley Fever
West Nile Virus
Japanese
Encephalitis
St. Louis
Encephalitis
Murray Valley
Ross River Virus
Influenza
Biological Agent
Plasmodium sp
(protozoa)
Trypanosoma sp.
(protozoa)
Leishmania sp.
(protozoa)
Flavivirus sp.
(virus)
Vibrio sp.
(bacteria)
Meningococcal
meningitis
(bacteria)
Flavivirus sp.
(virus)
Phlebovirus sp.
(virus)
Flavivirus sp.
(virus)
Flavivirus sp.
(virus)
Flavivirus sp.
(virus)
Flavivirus sp.
(virus)
Alphavirus sp.
(virus)
Influenzavirus sp.
(virus)
Vector
Anopheles sp.
(mosquito)
Glossina sp.
(tsetse fly)
Plebotomus sp.,
Lutzomyia sp.
(sand fly)
Aedes sp.
(mosquito)
Zooplankton
No vector,
transmission from
person to person
Aedes sp.
(mosquito)
Aedes sp.
(mosquito)
Culex sp.
Mosquito
Culex sp.
Mosquito
Culex sp.
Mosquito
Culex sp.
Mosquito
Aedes sp.
(mosquito)
No vector,
transmission from
person to person
Climate Sensitive
Rainfall, Temperature,
Humidity
Rainfall, Temperature,
Humidity
Rainfall, Temperature
Rainfall, Temperature
Rainfall, Temperature
Rainfall, Temperature,
Humidity, Dust
Rainfall, Temperature
Rainfall, Temperature,
Humidity
Rainfall, Temperature,
Humidity
Rainfall, Temperature,
Humidity
Rainfall, Temperature,
Humidity
Rainfall, Temperature,
Humidity
Rainfall, Temperature,
Humidity
Temperature
Climate sensitive diseases targeted by WHO
Rainfall observations
Four time-series graphs are generated providing an analysis
of recent rainfall with respect to that of recent seasons
Source: adapted from the WHO 2005
Source: IRI Data Library Map Room
S
OCIETAL
B
ENEFIT
A
REAS
– H
EALTH