


 186 / 280

[
] 186
able free of charge. The products are provided to the user commu-
nity via the IRI Data Library web site.
3
Users can remotely:
• Visualize a colour composite where the vegetation appears in
green, the bare soils in brown and the water in blue
• Compute long-term series of vegetation indices and compare them
with historical data.
Here, we select a location in North Kenya to display the evolution
of the Normalized Difference Vegetation Index (NDVI). This index
provides information on the vegetation status. The time-series for
years 2005, 2006 and 2007 indicates that November to December
2006 and January 2007 had vegetation index values greater than
those in 2005. The development of above normal vegetation in that
region during November to December 2006 was associated with an
outbreak of Rift Valley Fever.
Similarly, the National Malaria Control Program (NMCP) from the
Ministry of Health based in Asmara, Eritrea, monitors the develop-
ment of vegetation in the northern part of Eritrea along the Red Sea
Coast. Between December 2006 and April 2007, the NMCP noted
an increase in vegetation. Despite good environmental conditions,
the number of Malaria cases in the region remained under control.
However, the development of vegetation also created the perfect
conditions for the development of Desert Locusts. The same infor-
mation provided by IRI was used by the Food and Agriculture
Organization (FAO) of the United Nations and the Ministry of
Agriculture in Asmara to direct survey teams to the area.
Subsequently Desert Locusts were found, and an alert was issued by
FAO to the Ministries of Agriculture in countries potentially affected
by the locusts and to the donor community via the FAO Locust
Watch website.
4
While monitoring environmental conditions using
remotely sensed data plays an important role in assess-
ing the risk of epidemics, it is important to stress that
socio-economic, demographic and immunological
factors also play an important role in the vulnerability
of communities to the diseases. Early Warning Systems
that integrate all these factors must be implemented to
help health services to manage diseases more effectively.
Integration of remote sensing to
produce early warning systems
The concept of an early warning system for the predic-
tion of epidemics predates satellite technology by many
decades. In fact an early warning system in response to
the massive malaria epidemics that occurred periodi-
cally in pre-independence India was routinely operated
in the Punjab from the early 1920s until the early 1950s.
S. R. Christophers observed that between 1868 and 1908
severe and explosive ‘fever’ epidemics of two-to-three
month duration (August-October) were common in the
region.
5
In particular he noted that the worst of the
epidemics, which had a periodicity of seven-to-eight
years, coincided with high grain prices and famine.
Christophers saw this ‘human factor’ as an ‘essential
requirement’ which undermined the population and
resulted in high death rates as a result of the epidemics.
Despite this example, much of the interest in early
warning systems for Malaria epidemics was lost during
the Global Malaria Control/Eradication Era. It was not
until the 1990s that renewed interest was stimulated by
a number of epidemics reported from the East African
highlands and a regional epidemic in Southern Africa. At
its launch in 1998 the Roll Back Malaria partnership
recommended the development of a framework to estab-
lish Malaria Early Warning Systems (MEWS) in
sub-Saharan Africa. The MEWS framework sets out a
series of activities which together form the basis of an
integrated monitoring process to identify changes in
epidemic potential and increased risk of transmission.
In the MEWS framework, the first step involves consid-
eration of the dynamic factors which make populations
more vulnerable to severe epidemic outcomes. Drought,
inadequate food security and nutritional/economic status,
increasing levels of drug or insecticide resistance, reduc-
tion in health service provision or a high burden of other
diseases such as HIV/AIDS, compromise any immunity and
increase vulnerability to epidemics. While these factors are
unlikely to give an indication of when an epidemic might
occur, they do provide warning of the severity that can be
expected if one does occur and is not prevented.
The second MEWS monitoring process considers the
forthcoming season’s climate. Will it be a drier, normal,
or wetter season? A number of years of drought may
disrupt populations, lower immunity and make popu-
lations more susceptible when higher, or even normal
rainfall levels occur. The use of climate forecasts to
predict Malaria epidemics has been demonstrated in
Botswana, where climate forecast products predict the
occurrence of Malaria epidemics months in advance.
NDVI analysis
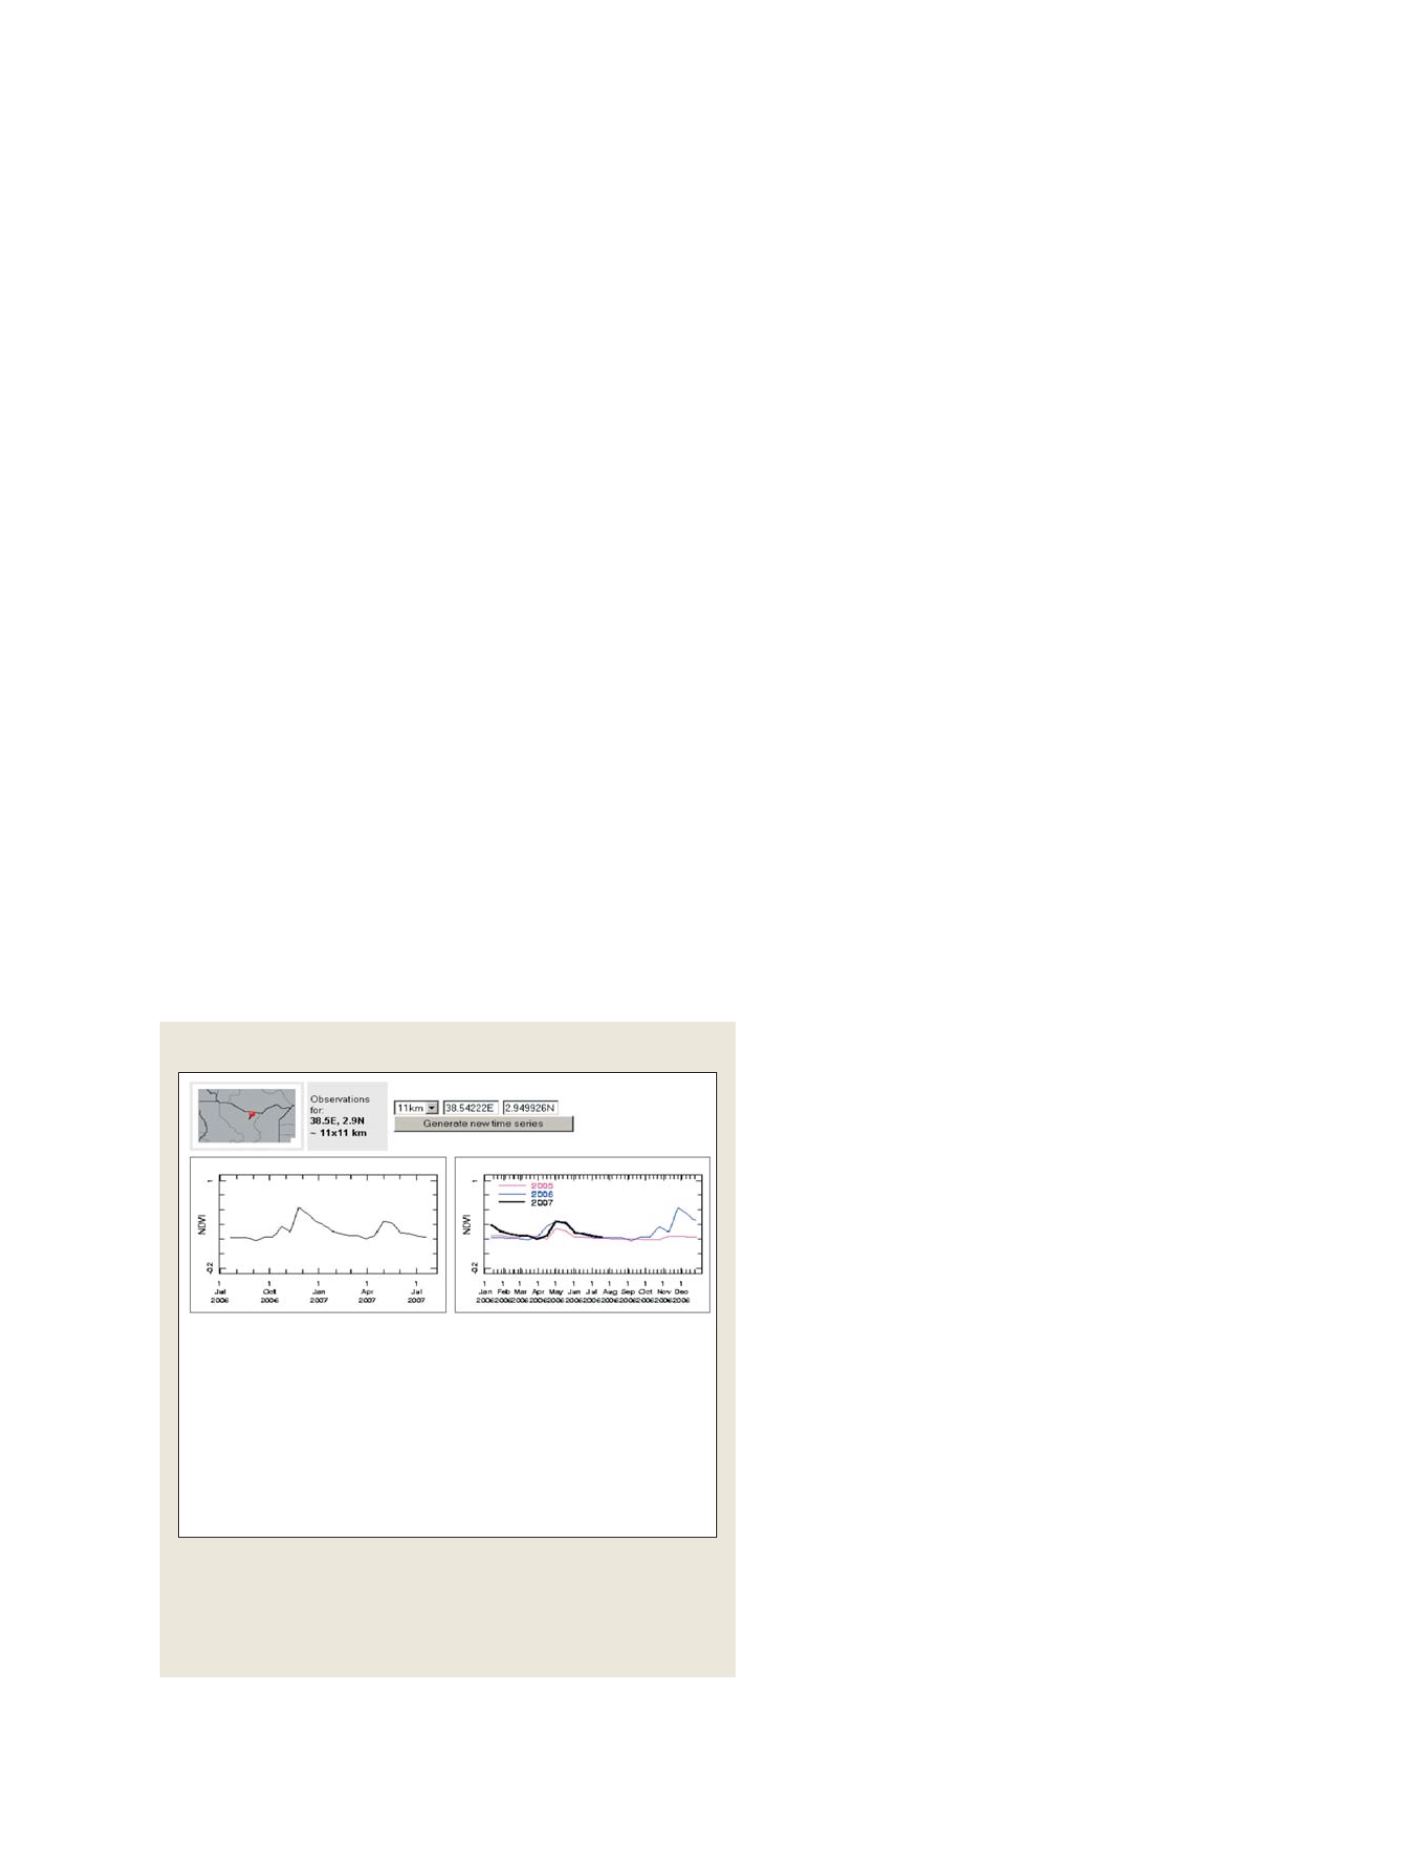
NDVI interface with time series extraction of any particular location of
interest – here, a location in North Kenya. The time-series for years 2005,
2006 and 2007 indicates that November to December 2006 and January
2007 had NDVI values greater than those in 2005. The development of
vegetation in that region was correlated with an outbreak of Rift Valley Fever
a) NDVI from most recent 12-month period
b) Multi-year NDVI comparison
Description
a) 16-day Normalized Difference Vegetation Index (NDVI) for the selected region during the most recent 12
month period.
b) Same as (a) for the current calendar year (thick black line), as indicated by the axis labels. NDVI estimates
from previous years are also shown (blue: -1 yr from present; magenta -2 yr from present).
Data Sources
Normalized Difference Vegetation Index
Data: 16-day NDVI at a resolution of 250m
Data Source: United States Geological Survey, Land Processes Distributed Active Archive Center, Moderate
Resolution Imaging Spectroradiometer (USGS LandDAAC MODIS)
Source: IRI Data Library Map Room
S
OCIETAL
B
ENEFIT
A
REAS
– H
EALTH