


 191 / 280

[
] 191
AIRNow: the beginning
Phil Dickerson, AIRNow Programme Director, US EPA
T
he average adult breathes 13,000 litres of air each day,
making air quality a critical public health issue. Air is all
around us, yet invisible. Poor air quality is an insidious
problem that is difficult to sense and impossible for the public
to measure. In an attempt to counter this problem the US
Environmental Protection Agency (EPA) created the AIRNow
programme in 1995.
AIRNow was founded upon the principle of protecting public health
by offering real-time air quality data and forecasts. Based upon that
vision, EPA developed AIRNow from a small regional programme
with three data polls each day, to a nationwide programme featuring
hourly data, hundreds of maps, forecasts and information on
air quality.
The Air Quality Index
To make real-time data meaningful to the general public, EPA devel-
oped the Air Quality Index (AQI), a colour-coded scale that ties air
quality concentrations to health effects.
AIRNow-International
Air quality is a worldwide problem. Developing countries are
installing air quality monitoring networks and beginning to forecast
air pollution levels to help address this challenge. Equally important
is developing methods to effectively communicate information and
educate the public about air quality conditions.
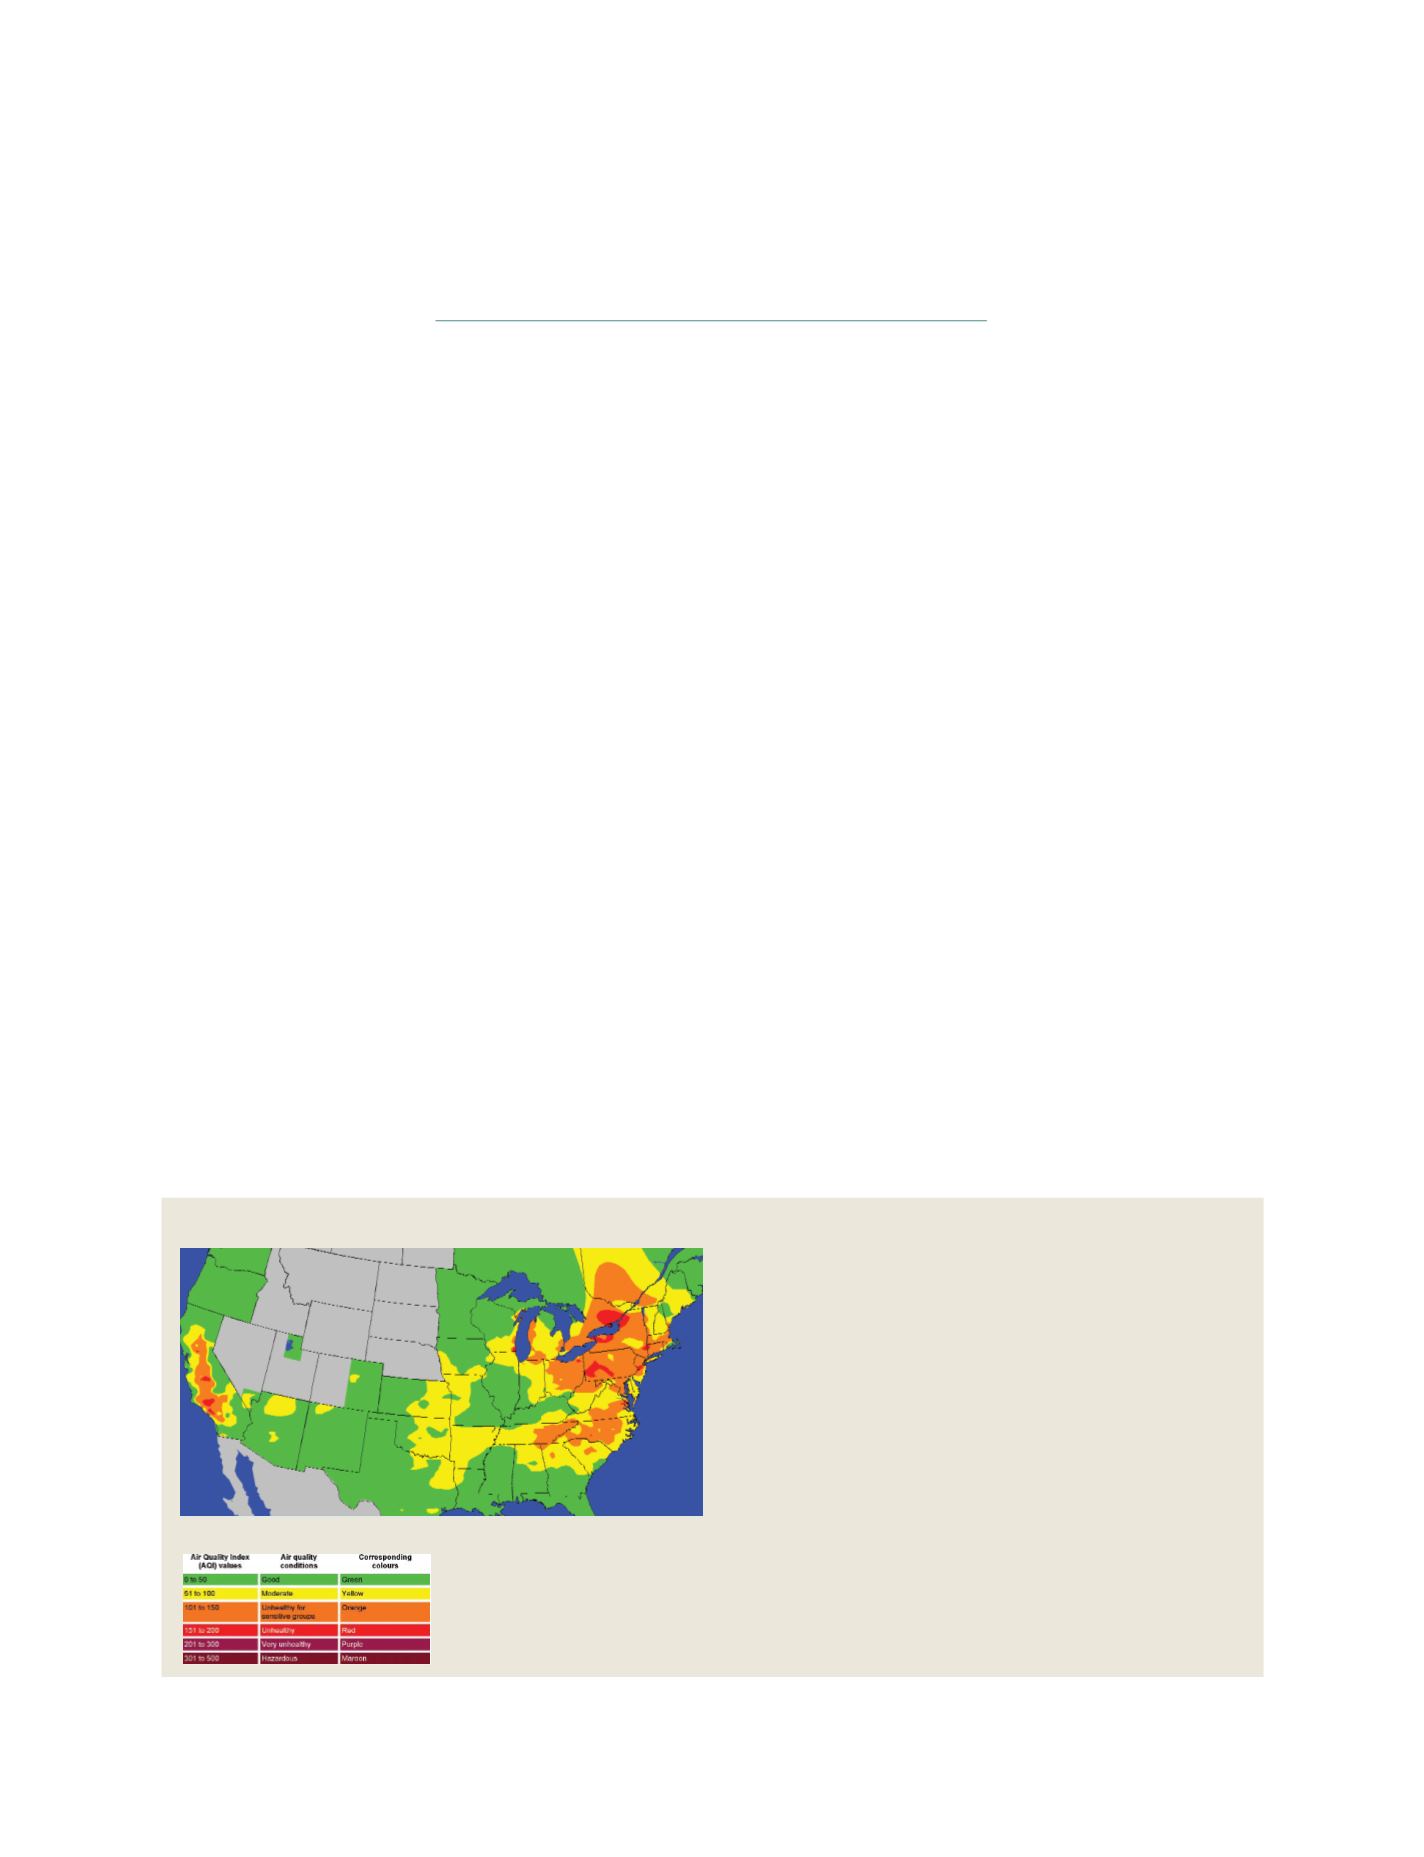
Air quality conditions relating to AQI values
This educational effort is consistent with the World
Health Organization’s guidelines for air quality, which
state that public information systems are playing an
increasingly important role in raising awareness,
warning of pollution episodes and advising susceptible
population subgroups. An especial problem facing air
quality agencies in developing countries is a lack of soft-
ware and knowledge about how to effectively
communicate this information to the public.
The EPA’s AIRNow programme has been shown to be
a successful model for communicating air quality condi-
tions and forecasts to the public. It has become the
national resource and focal point for decision makers,
the media and the public to access air quality informa-
tion. AIRNow displays air quality conditions using
animated maps with colours that correspond to the AQI.
These maps are shown on the programme’s website
(www.airnow.gov) along with information about health
impacts from air pollution and suggestions about what
individuals can do to improve air quality. In addiion,
EPA has developed training, outreach and educational
materials about the health effects of poor air quality and
guidance on public health protection.
Several countries have expressed interest in the
AIRNow system; however, the current system is a
customized collection of software programs and data-
Good – The AQI value is between 0 and 50. Air quality is considered
satisfactory, and air pollution poses little or no risk.
Moderate – The AQI is between 51 and 100. Air quality is
acceptable, though for some pollutants there may be a moderate
health concern for a very small number of people.
Unhealthy for sensitive groups – When AQI values are between 101
and 150, members of sensitive groups may experience health effects.
For example, people with lung disease are at greater risk from exposure
to ozone, while people with either lung or heart disease are at greater
risk from exposure to particle pollution. The general public is not likely
to be affected when the AQI is in this range.
Unhealthy – Everyone may begin to experience health effects when
AQI values are between 151 and 200. Members of sensitive groups
may experience more serious health effects.
Very unhealthy – AQI values between 201 and 300 trigger a health
alert, meaning everyone may experience more serious health effects.
Hazardous – AQI values over 300 trigger health warnings of
emergency conditions. The entire population is likely to be affected
15 August 2007
S
OCIETAL
B
ENEFIT
A
REAS
– H
EALTH
Source: EPA