


 197 / 280

[
] 197
NASA researchers have participated in American Society of
Heating, Refrigerating and Air-Conditioning Engineers (ASHRAE)
meetings and in its Meteorology and Climate subcommittee.
Sample datasets were made available for evaluation by committee
members. These datasets specifically address unmet data needs
for clear-sky solar flux information for the building design
community.
Climate change impacts
In the energy market forecasting and climate change
impacts community, integrated assessment models are
increasingly used to assess policy options for climate
change mitigation and adaptation. The US Pacific
Northwest National Laboratory’s (PNNL) MiniCAM
market forecast model is one such integrated assessment
model. MiniCAM has a detailed representation of energy
technologies for energy supply and end use. NASA has
provided surface solar energy datasets specifically
designed to meet input needs of MiniCAM’s renewable
energy module. The impact of the NASA inputs is
currently being evaluated and we plan to provide addi-
tional datasets for use by MiniCAM and other integrated
assessment models.
The Program conducted a stakeholder’s workshop in
early 2007 which engaged other US Government agen-
cies, electric power utilities, and the private sector to
understand user requirements and assess how NASA-
derived measurements could meet some of these needs.
Stakeholders expressed a strong interest in understanding
future climate change impacts, especially considerations
such as land use, temperature, and reducing uncertain-
ties in forecasts to enable adoption and mitigation. The
Program will begin assessing the utility of downscaled
global climate model predictions to inform regional
climate change impacts in the Energy sector.
Space weather impacts
Enhanced solar activity can cause disruptions to electric
power transmission systems. A notable example was the
major X-class solar flare on 13 March 1989, and its resul-
tant geomagnetic disturbance which led to instability in
Hydro-Quebec’s electric power grid, leaving six million
people without power for nine hours. The Energy
Management Program has partnered with the Electric
Power Research Institute’s (EPRI) SUNBURST network
to enhance its capability for predicting geomagnetically
induced currents (GIC) and their impacts on the power
transmission system using NASA observations of the near-
Earth environment (including the Solar and Heliospheric
Observatory (SOHO), Solar Terrestrial Relations
Observatory (STEREO), Advanced Composition Explorer
(ACE), Wind and Geotail) together with a suite of models
that predict the ground-based impact of these solar distur-
bances. SUNBURST predictions may be used by electric
power companies to better predict the potential for
damaging GIC events.
By developing data products using NASA spaceborne
measurements and model predictions in close cooperation
with decision makers, using consistent units, and deliv-
ered in easy-to-use interfaces, the NASA Applied Sciences
Program Energy Management application advances the
uptake of Earth observations and models to improve deci-
sion-making in the Energy sector worldwide. The Program
works closely with the Group on Earth Observations
(GEO) Energy Community of Practice to ensure that our
activities are aligned with GEO Energy work plan goals to
improve the management of energy resources.
NASA’s spacecraft constellation monitoring the Earth-Sun system
Observations from many of these spacecraft have been used to inform
decision making in the energy sector by providing Earth radiation, solar, and
near-Earth environment datasets
Source: NASA
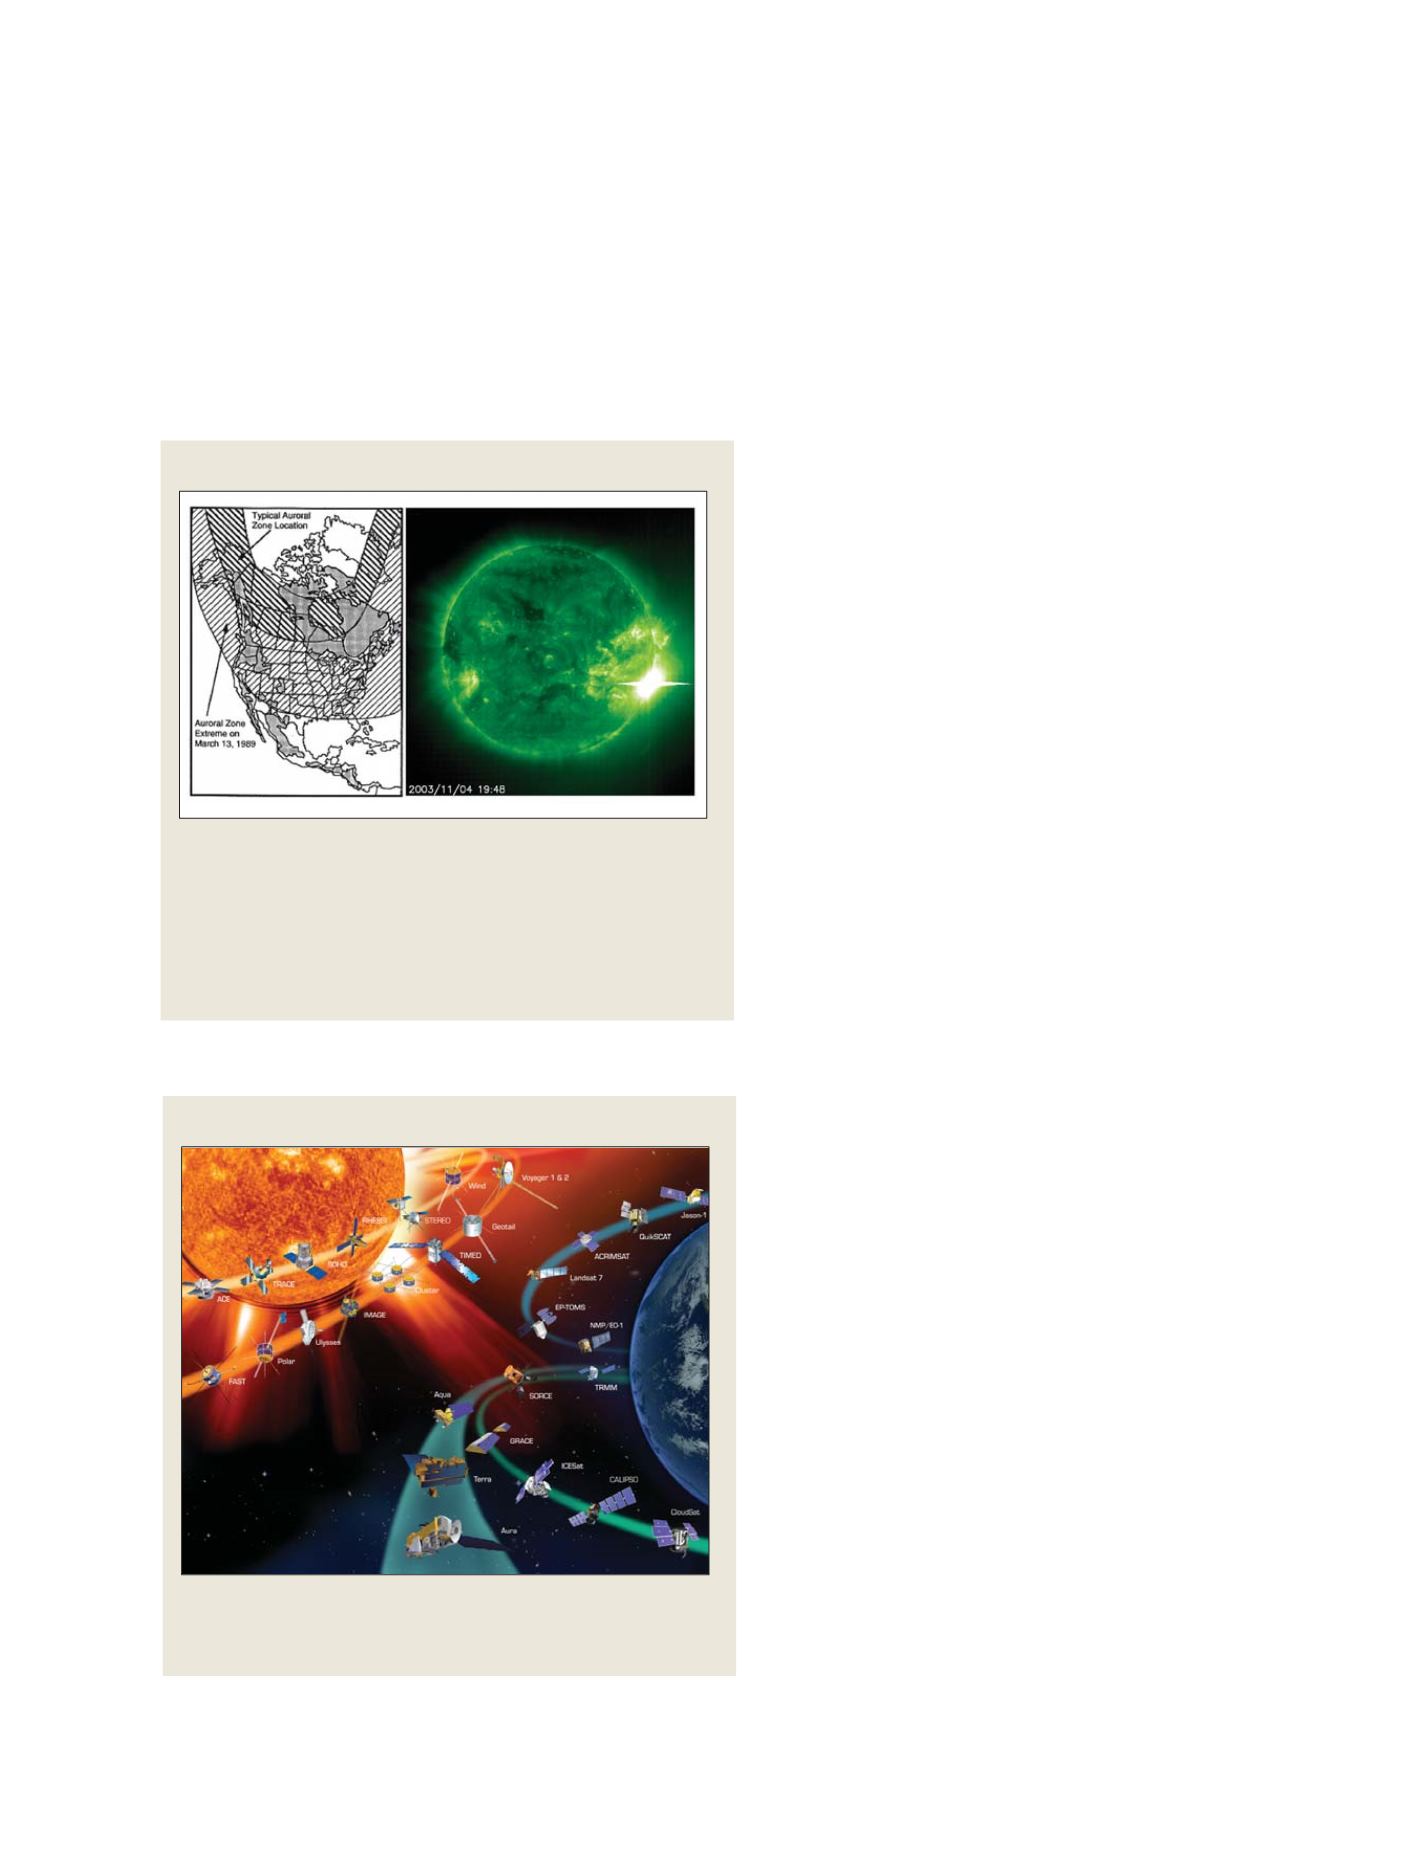
Geomagnetically induced current events
Power systems in areas of igneous rock (grey) are the most vulnerable to
the effects of intense geomagnetic activity because the high resistance of
igneous rock encourages geomagnetically induced currents (GICs) to flow
in the power transmission lines situated above the rock. (Left) Shown in
cross-hatching are the auroral zone and the extremes that the aurora can
reach during severe disturbances such as 13 March 1989. (Right) NASA
provides solar and near-Earth environment data sets used by models to
predict GIC events
Left image: J. Kappenman, EOS, 29 January 1997, p. 37. Right image: NASA
S
OCIETAL
B
ENEFIT
A
REAS
– E
NERGY