


 194 / 280

[
] 194
The pilots in Nova Scotia and British Columbia
suggest that the public want to have the AQHI ‘pushed’
to them; their preference is not to access websites or
phone systems to receive this information. In the
Toronto introduction of the index, local and national
media are willingly carrying the AQHI in limited
regional feeds and they will also be enthusiastic partic-
ipants as the index is rolled out across Canada.
The future of the AQHI
Environment Canada will continue to support the
expansion and transition from the existing single-pollu-
tant, threshold-based forecast to the new multi-pollutant
prediction requirements for the AQHI. Implementing
the index across Canada over the coming years will
necessitate the development, testing and implementa-
tion of new models and techniques to assist forecasters
with issuing AQHI forecasts.
EC will expand its Internet presence to support
dynamic dissemination of the AQHI through the
‘Weatheroffice’ website
(www.weatheroffice.ec.gc.ca)which receives up to 1.7 million visits daily. EC will
continue to develop and maintain the AQHI informa-
tion website
(www.ec.gc.ca/cas-aqhi)and base
improvements on user feedback. National implementa-
tion of the AQHI in major urban centres is expected to
be completed over the next four years.
The AQHI demonstrates how Canadian expertise in
health science, air quality forecasting and earth obser-
vations networks can merge to produce societal benefits.
It also illustrates how improved understanding of envi-
ronmental factors affecting human health and well-being
may lead to an information tool which has the poten-
tial of improving the health of all Canadians. Like the
Canadian developed UV index, the AQHI provides an
easy to understand, informative package with specific
recommendations on how to reduce the risk associated
with air pollution in a community. The potential bene-
fits to society of a nationally implemented AQHI include
improved health, better quality of life and economic
returns through reduced health care costs and fewer
absences from work.
methodology better characterizes the community health risk asso-
ciated with an air pollution mixture composed of ground-level ozone,
particulate matter, and nitrogen dioxide. The science underlying the
new index has been published in the peer-reviewed literature and
undergone two additional scientific peer reviews.
Presentation of the AQHI
The AQHI uses a colour scale of 1 to 10+ to represent the health
risks posed by the air pollutant mixture for current and forecast
conditions. The scale is divided into categories that describe the rela-
tive health risk as low, moderate, high or very high. For each category
there are associated health messages that provide concrete advice on
how to reduce those risks. Two sets of messages have been devel-
oped; one for the general public and the other for those at greater
risk, as noted in the introduction. The presentation elements are
integrated into an informative graphic, which is updated hourly and
made available on the Internet as new air pollution monitoring data
are captured, processed and linked to the appropriate forecast period.
Using this approach the data collected are transformed into a
communication tool.
Data acquisition
The delivery of the AQHI to Canadians is built upon real time air
quality data from Environment Canada’s rural-based Canadian Air
and Precipitation Monitoring Network (CAPMoN) and the largely
urban-based Canadian National Air Pollution Surveillance (NAPS)
network, in partnership with the provinces and municipalities. These
data are captured at the Canadian Meteorological Centre and used in
the production of forecast products and in providing real-time AQHI
conditions. The integration of data from disparate networks is a
fundamental thrust to the GEO initiative.
User interface – implementation
Environment Canada is responsible for environmental stakeholder
relations on the implementation of the AQHI. Operational tests
conducted in the provinces of Nova Scotia in 2006 and in British
Columbia in 2005 and 2006, have resulted in several improvements
to the new index. More importantly, these tests confirmed the
appetite for such a personal health protection tool. The success of
these pilots laid the foundation for a national introduction of the
AQHI, which began in July 2007 in Toronto. This will expand in
2008 to the Greater Toronto Area, which comprises 15 per cent of
Canada’s population.
The collaboration among environment and health departments at
all levels of government, non-governmental organizations and the
communications industry which characterized the development
phase, will be an ongoing feature of the implementation of the index
over the coming years. The presentation of the index will be adapted
to requirements set by local and provincial health authorities.
Building capacity within the health sector jurisdictions to respond to
public interest in the AQHI is a focus for the approach.
Lessons learned
Testing of the index to date has shown that it raises interest in not
only health aspects of air quality, but also on measures one may take
to reduce personal contributions to community air pollution. Support
will be made available to non-governmental organizations to develop
strategies that use the AQHI as a tool to encourage reduced air pollu-
tant and greenhouse gas emissions.
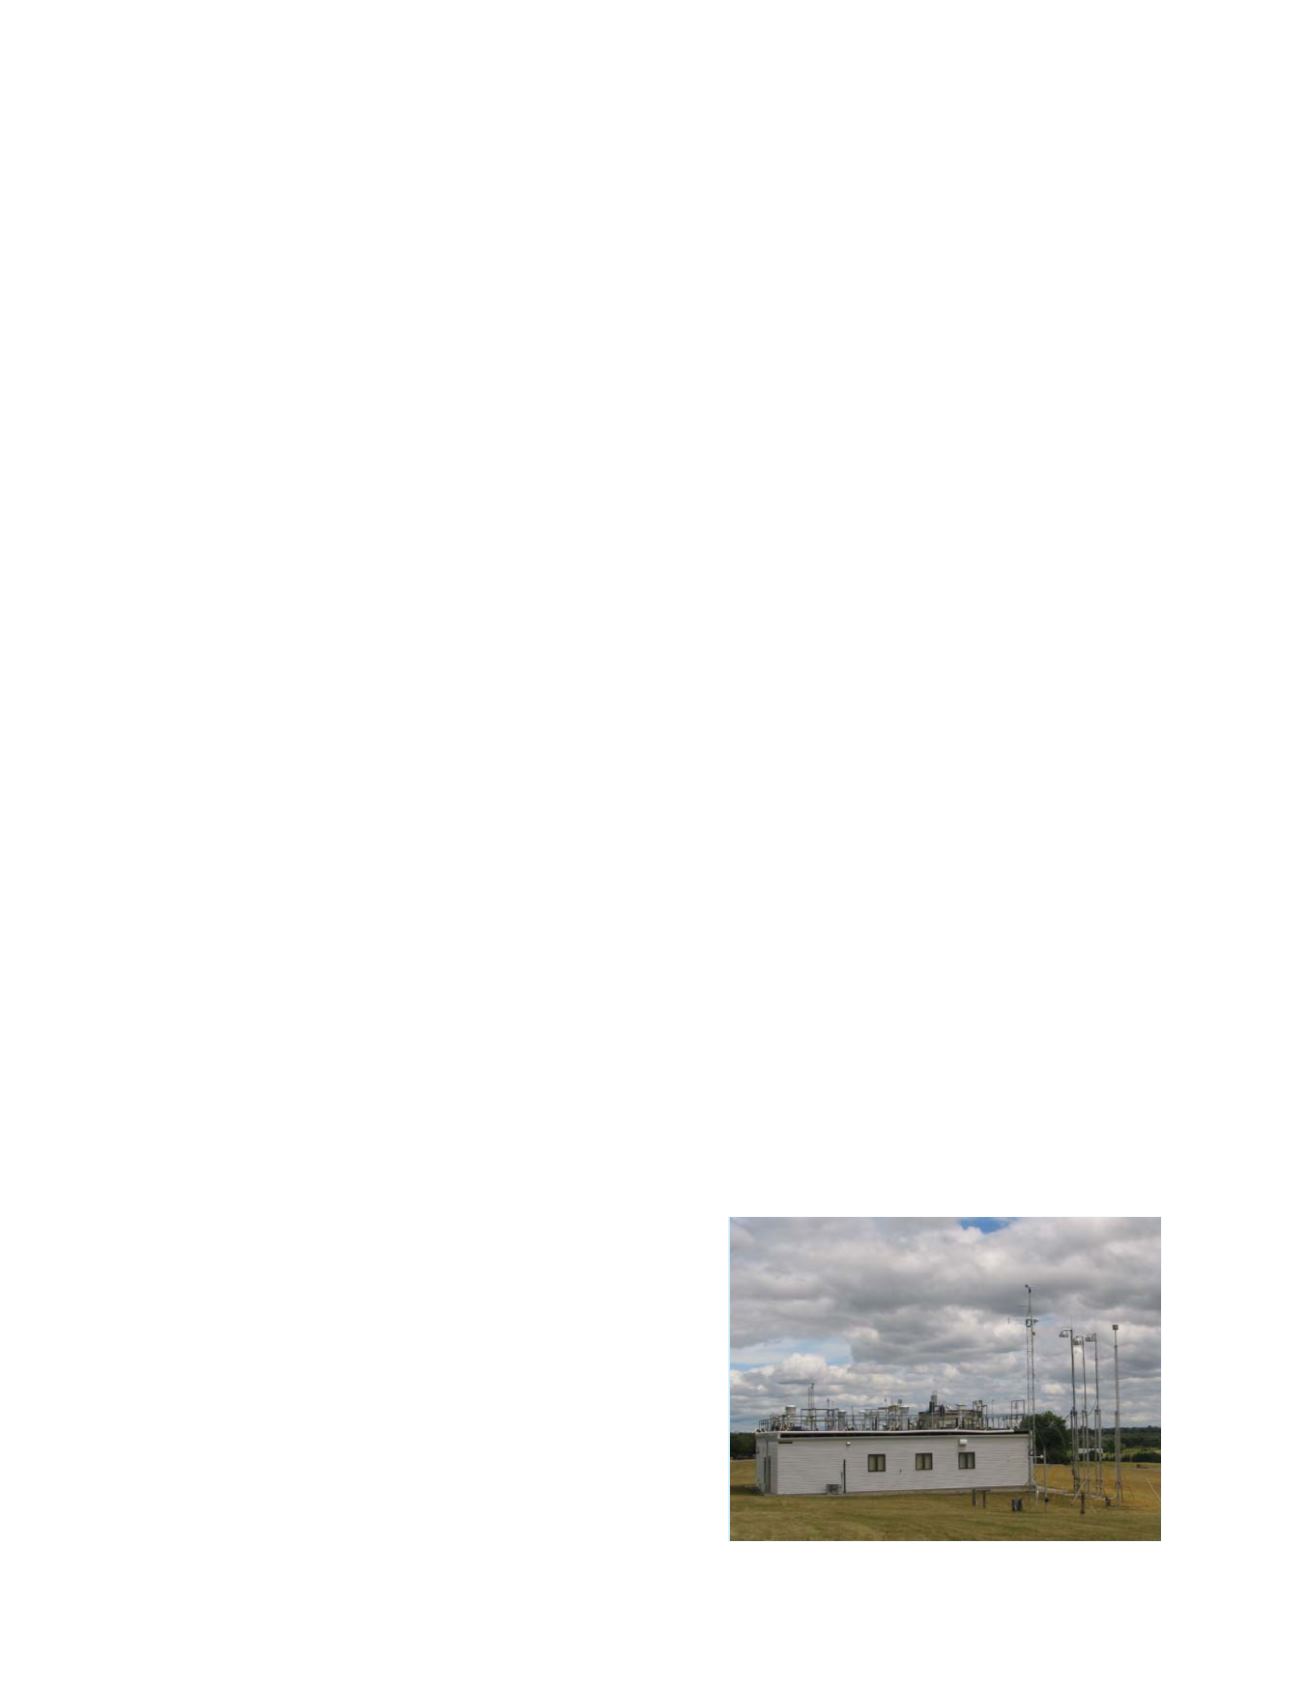
The Canadian Air and Precipitation Monitoring Network
Photo: Richard Tanabe – July 2007
S
OCIETAL
B
ENEFIT
A
REAS
– H
EALTH