


 65 / 288

[
] 66
A
griculture
Analyzing the data on sea surface temperature
(SST) and other parameters from a variety of global
sources, Vivekanandan et al. (2009) found warming of
the sea surface along the entire Indian coast. The SST
increased by 0.2
o
C along the northwest, southwest
and northeast coasts and by 0.3
o
C along the southeast
coast during the 45-year period from 1961 to 2005.
The study has predicted that the annual average SST
in the Indian seas would increase by 2.0
o
C to 3.5
o
C by
2099. The study has also predicted several scenarios,
which include regional extinction of some tropical fish
stocks and some other stocks moving towards higher
latitudes. Other studies carried out by the Indian
Council of Agricultural Research in this regard show
that different Indian marine species will respond to
Given the scenario, it is difficult to predict the impact of a shock or
stimulus such as changing climate. While gauging the impacts of
the changing climate is a priority area in research and policy discus-
sions, different scenarios have emerged from such discourses, which
are at best conjectures. As a result, dealing with climate change
requires flexibility and constant monitoring for timely action.
Possible impact of changing climate on the fisheries sector in
the BOBLME region
A global study, Vulnerability of National Economies to the Impacts
of Climate Change on Fisheries,
3
has estimated the sensitivity,
adaptive capacity and vulnerability of the national economies
to changing climate and shows that the region has low adaptive
capacity and is moderately vulnerable, except Bangladesh, which
is highly vulnerable.
Country
Bangladesh
a
India
a
Indonesia
b
Malaysia
b
Maldives
a
Myanmar
b
Sri Lanka
a
Thailand
b
Fisher folk
population (2010)
902,961
4, 054,802
5,971,725
155,913
14,241
3,160,070
825,200
-
Total fishing fleet (2010)
50,555
194,490
570,827
49,756
979
32,824
46,138
-
Exclusive economic zone
(sq km)
c
78,538
2,290,268
3,617,349
447,276
916,189
520,262
530,684
306,365
Marine capture fisheries production,
2010 (in tonnes)
607,492
3,226,213
5,039,416
1,428,881
94,953
2,048,590
385, 058
1,617,399
Fisher population and total fishing fleet in the BOBLME region
Source: a. Anon (2012) Annual report of the Bay of Bengal Programme Inter-Governmental Organisation. BOBP-IGO, 2012; b. Anon (2010) Fishery Statistics Bulletin of
Southeast Asia. SEAFDEC, 2010; c. Sea Around Us Project, 2012 (May differ with EEZ presented by national governments)
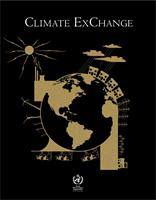
Interaction with Sembasipalli fishers on the impact of climate change on fisheries
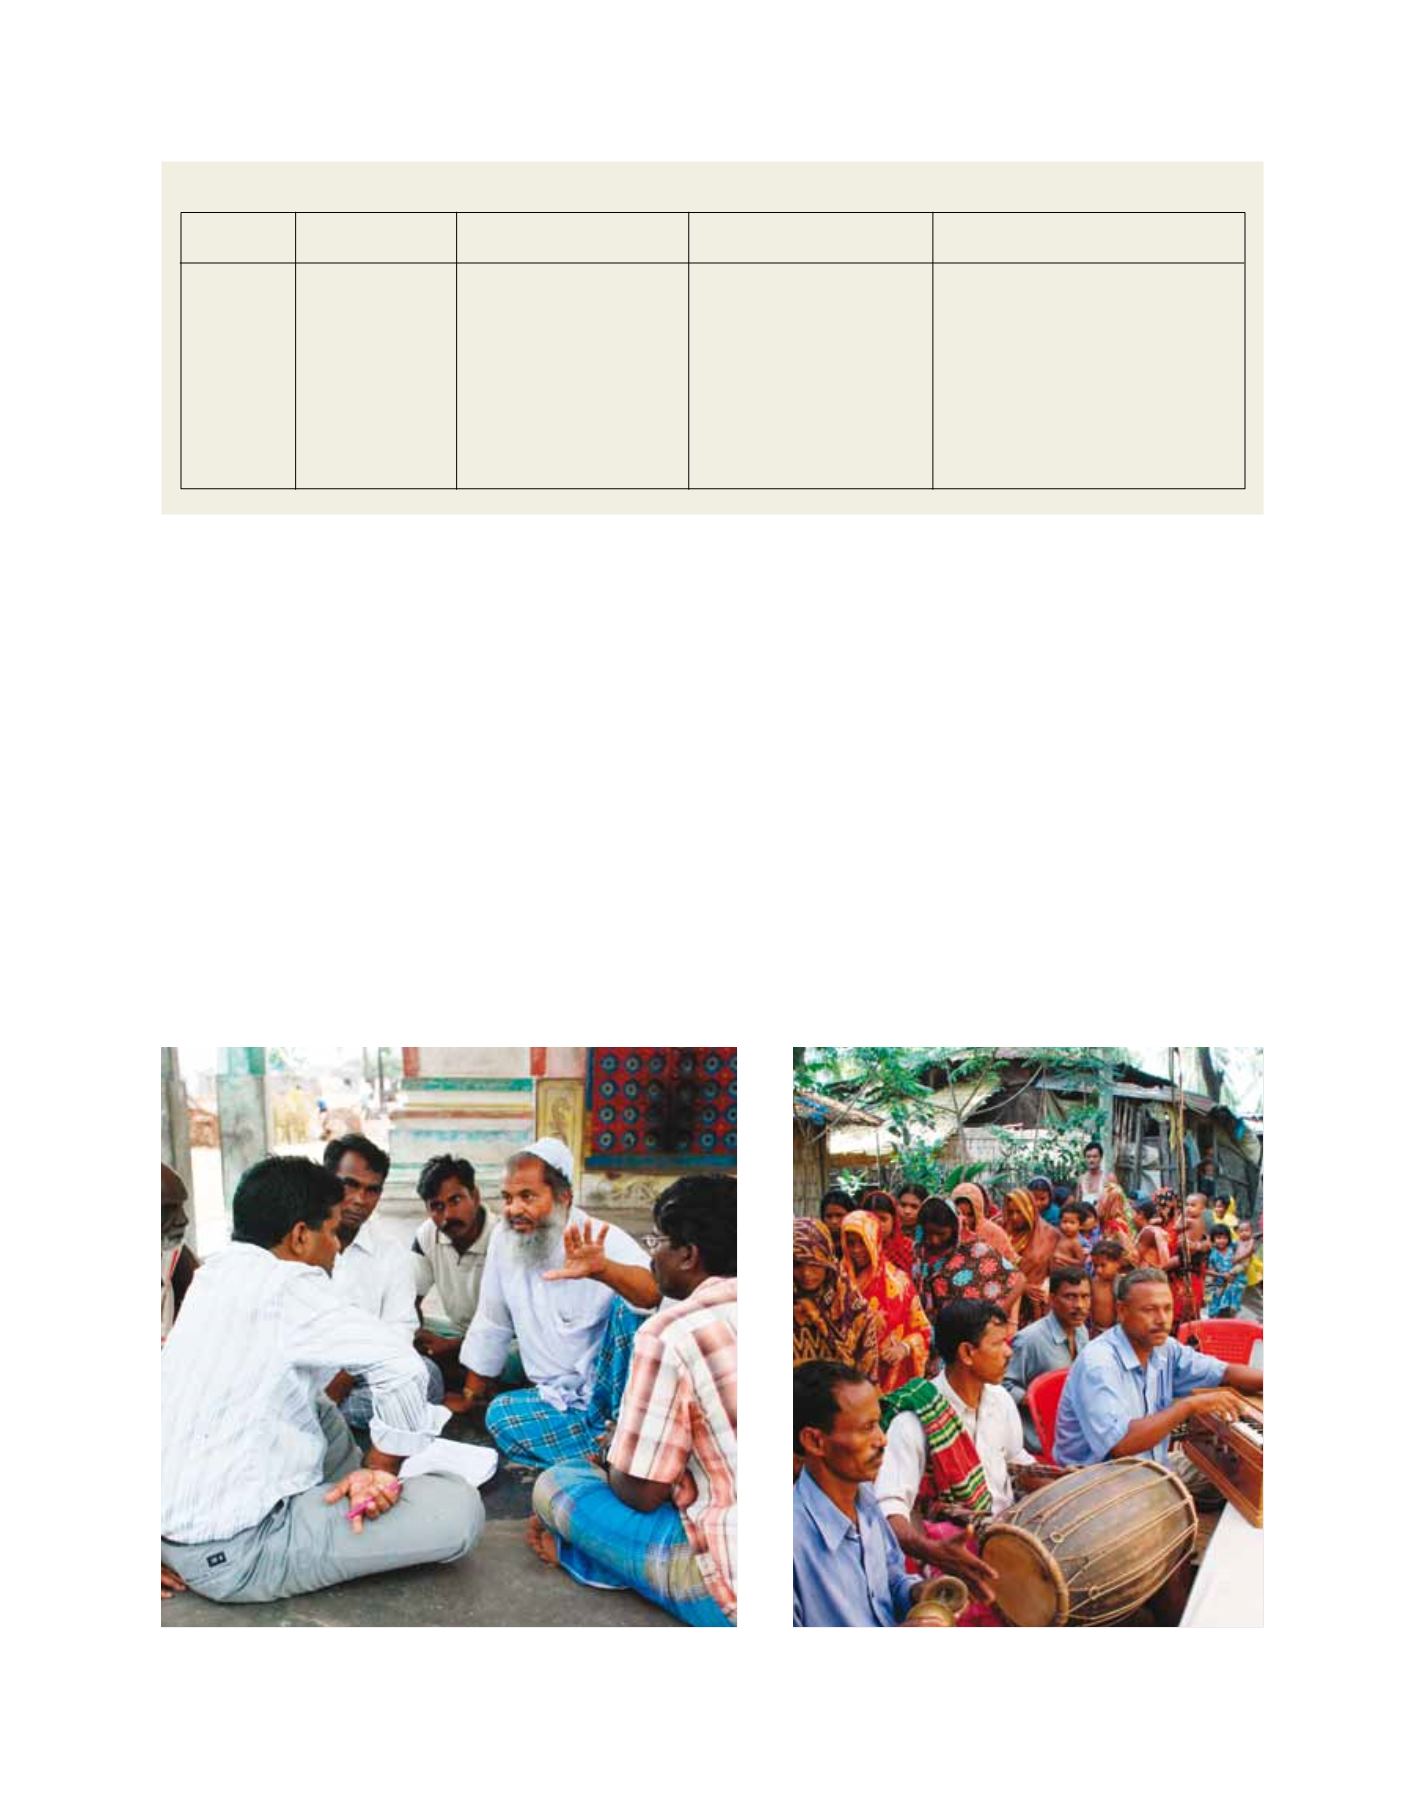
Awareness programme for fishers in Cox’s Bazaar, Bangladesh
Image: S Jayaraj
Image: S Jayaraj