


 91 / 288

W
ater
exchange portals could help to push data faster through
the model chain. This could set resources free for
additional post-processing steps, more in-depth data
evaluation, and individual user support. Moreover,
the coherency of the presentation of the different serv-
ices could be improved.
A topic already scheduled by KLIWAS is the improve-
ment of seasonal to decadal prediction capabilities. In
addition to work on medium-range weather forecasts,
the hydrological system offers many opportunities here
through its slow components (snow and groundwater
storage). These will be exploited in the coming years.
With its current human, infrastructural, institutional, and
procedural capacities, KLIWAS has reached a service level that is
acceptable for many users. The evaluation framework is particu-
larly appreciated. For example, the Water director of Germany
concludes, that “KLIWAS breaks new methodical ground as a
pioneer and pathfinder towards the establishment of a multi-
model approach. The representation of the spans of possible
projections provides a new quality for climate risk assessment
to decision makers.”
7
However, a higher service level is still conceivable and would
help to support additional user groups with more specific infor-
mation. For example, technical improvements like advanced data
[
] 92
Appendix A: Evaluation of climate models and climate change
All available regional climate model outputs are evaluated with respect to the target statistics listed in the table below. The initial temporal resolution is 1 day.
Unless otherwise noted, the evaluation is done on a multi-annual basis for months, meteorological seasons, hydrological half-years, and years in the periods
1961-1990, 2021-2050, and 2071-2100 (minimum choice). Reference regions are shown in the figure below.
Subset of the statistical values chosen for the evaluation of precipitation and 2m air temperature outputs of climate models. In addition, fields of
global radiation, relative humidity, wind speed, and evaporation are evaluated (not shown here)
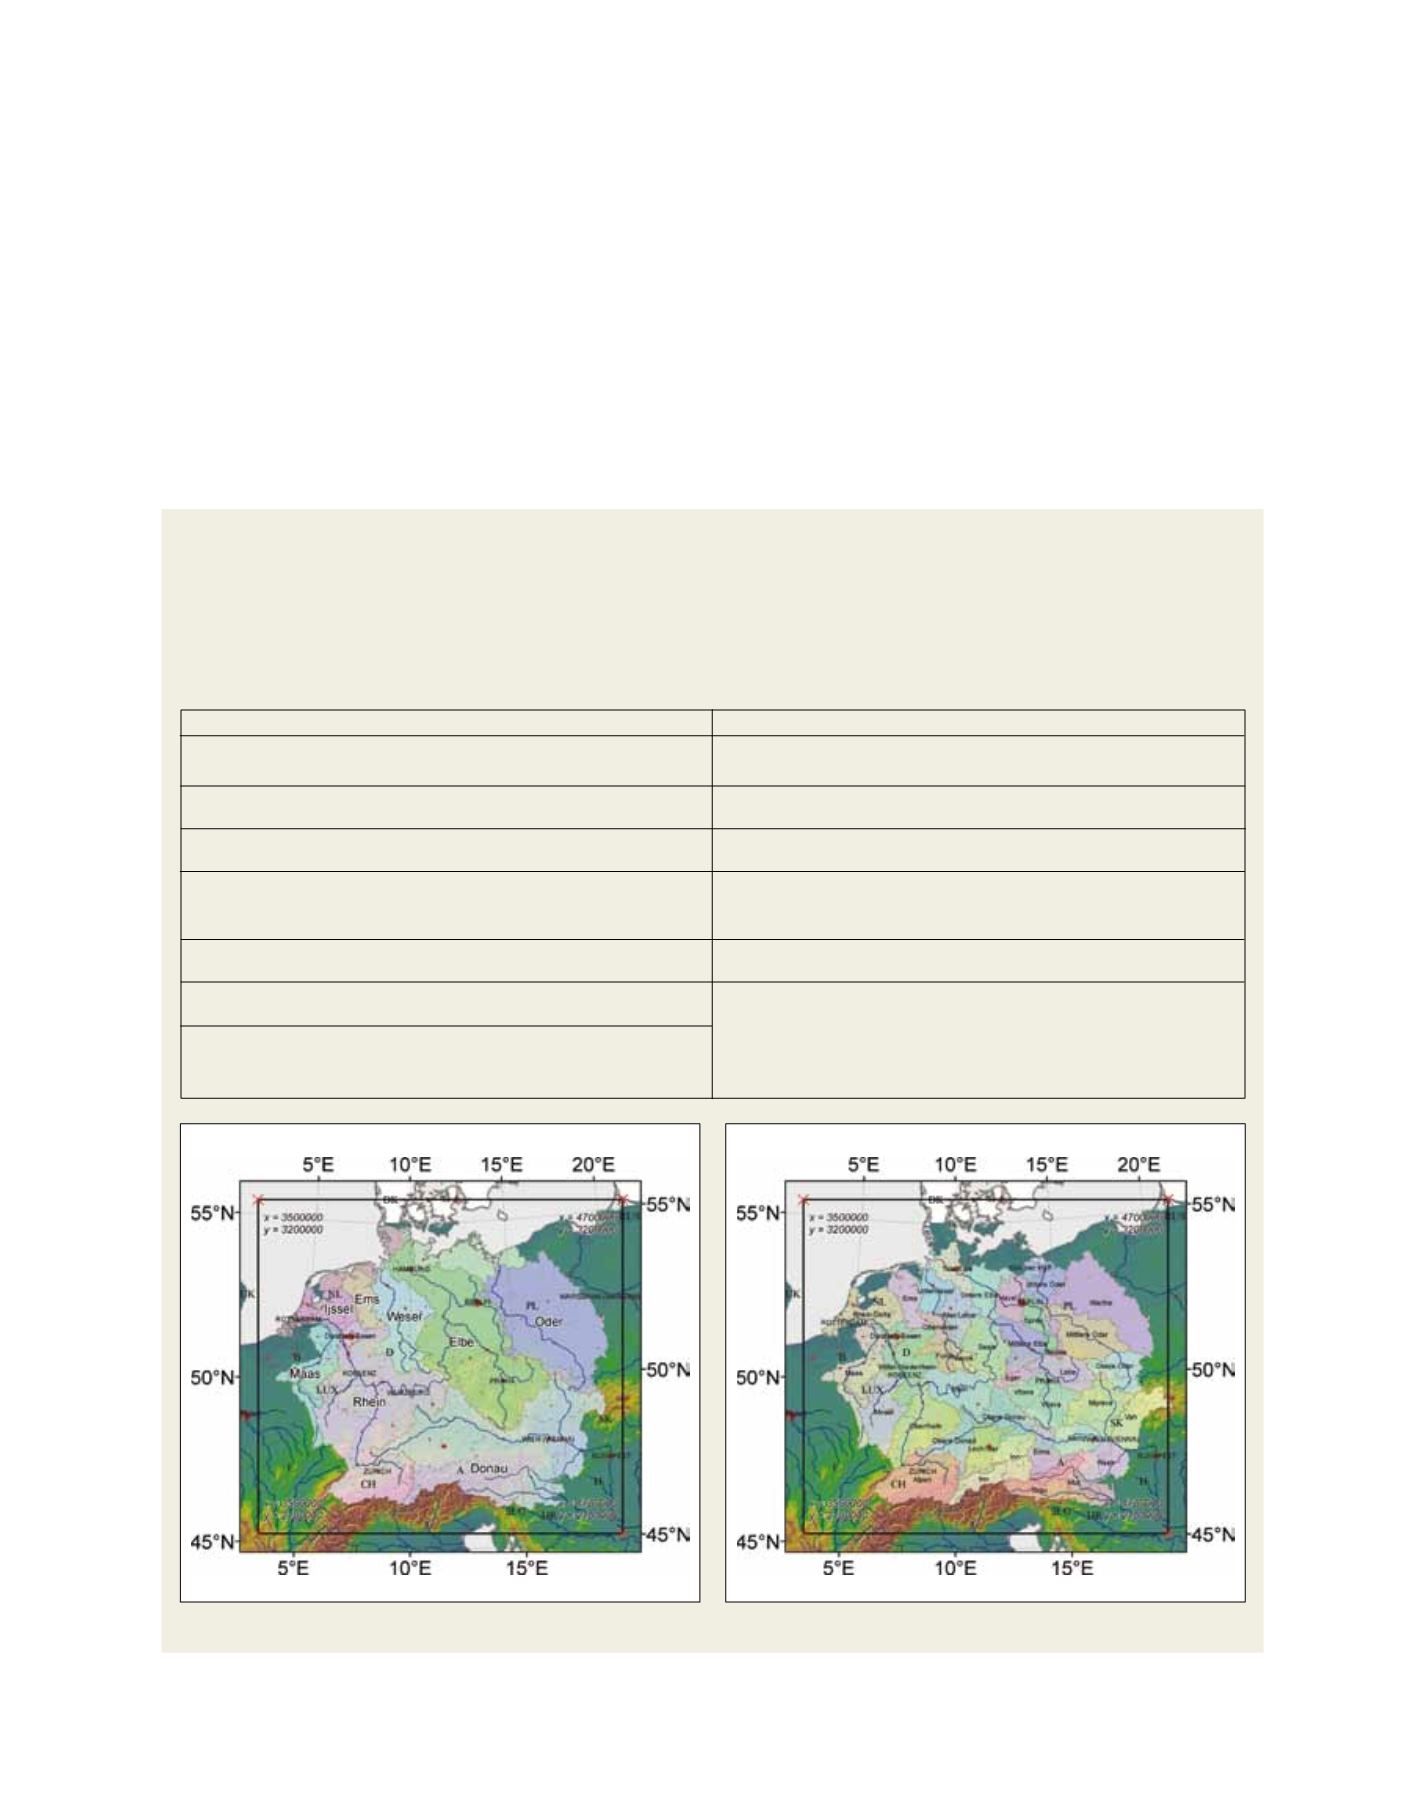
Reference regions (LEFT: level 1, large scale; RIGHT: level 2, meso scale) chosen for the evaluation of climate models and climate change
Precipitation [mm]
Precipitation amount (sum)
Precipitation intensity
Precipitation anomaly
Number of days with precipitation exceeding a defined threshold
(e.g. >10 mm, >20 mm etc.)
Number of dry days
Maximum period of consecutive dry days
Precipitation amount during a defined number of days
(1, 2, 3, 5, 10, 15 and 30 days)
2m air temperature [°C]
Maximum, mean, and minimum daily temperatures
Number of very warm days (maximum temperature > 25°C)
Number of frost days (minimum temperature < 0°C)
Number of ice days (maximum temperature < 0°C)
Cold sums (sum of daily temperatures below 0°C from Nov to Mar)