


 92 / 288

W
ater
[
] 93
Appendix B: Evaluation of hydrological models and hydrological change
Inland hydrology
Low, mean, and high river discharge (MNQ, MQ, MHQ)
Percentiles of the flow duration curve (FDC_Q97, FDC_Q95, FDC_Q90,
FDC_Q10, FDC_Q05)
Lowest mean discharge in a period of time (NMxQ with x = 1, 7 or 21 days)
Highest mean discharge in a period of time (HMxQ with x = 1 or 7)
Mean number of days within a period of time below and above a certain
discharge threshold
Maximum number of days within a period of time below and above a
certain discharge threshold
Coastal hydrology
Low and high water (MLW, MHW and probability density functions)
Mean sea level (MSL)
Tidal range (MTR)
Probability density functions of significant wave height and mean wave
period
The hydrological model outputs are evaluated with respect to the target statistics listed in the table below. The initial temporal resolution is 1 day. Unless
otherwise noted, the evaluation is done on a multi-annual basis for months, meteorological seasons, hydrological half-years, and years in the periods 1961-
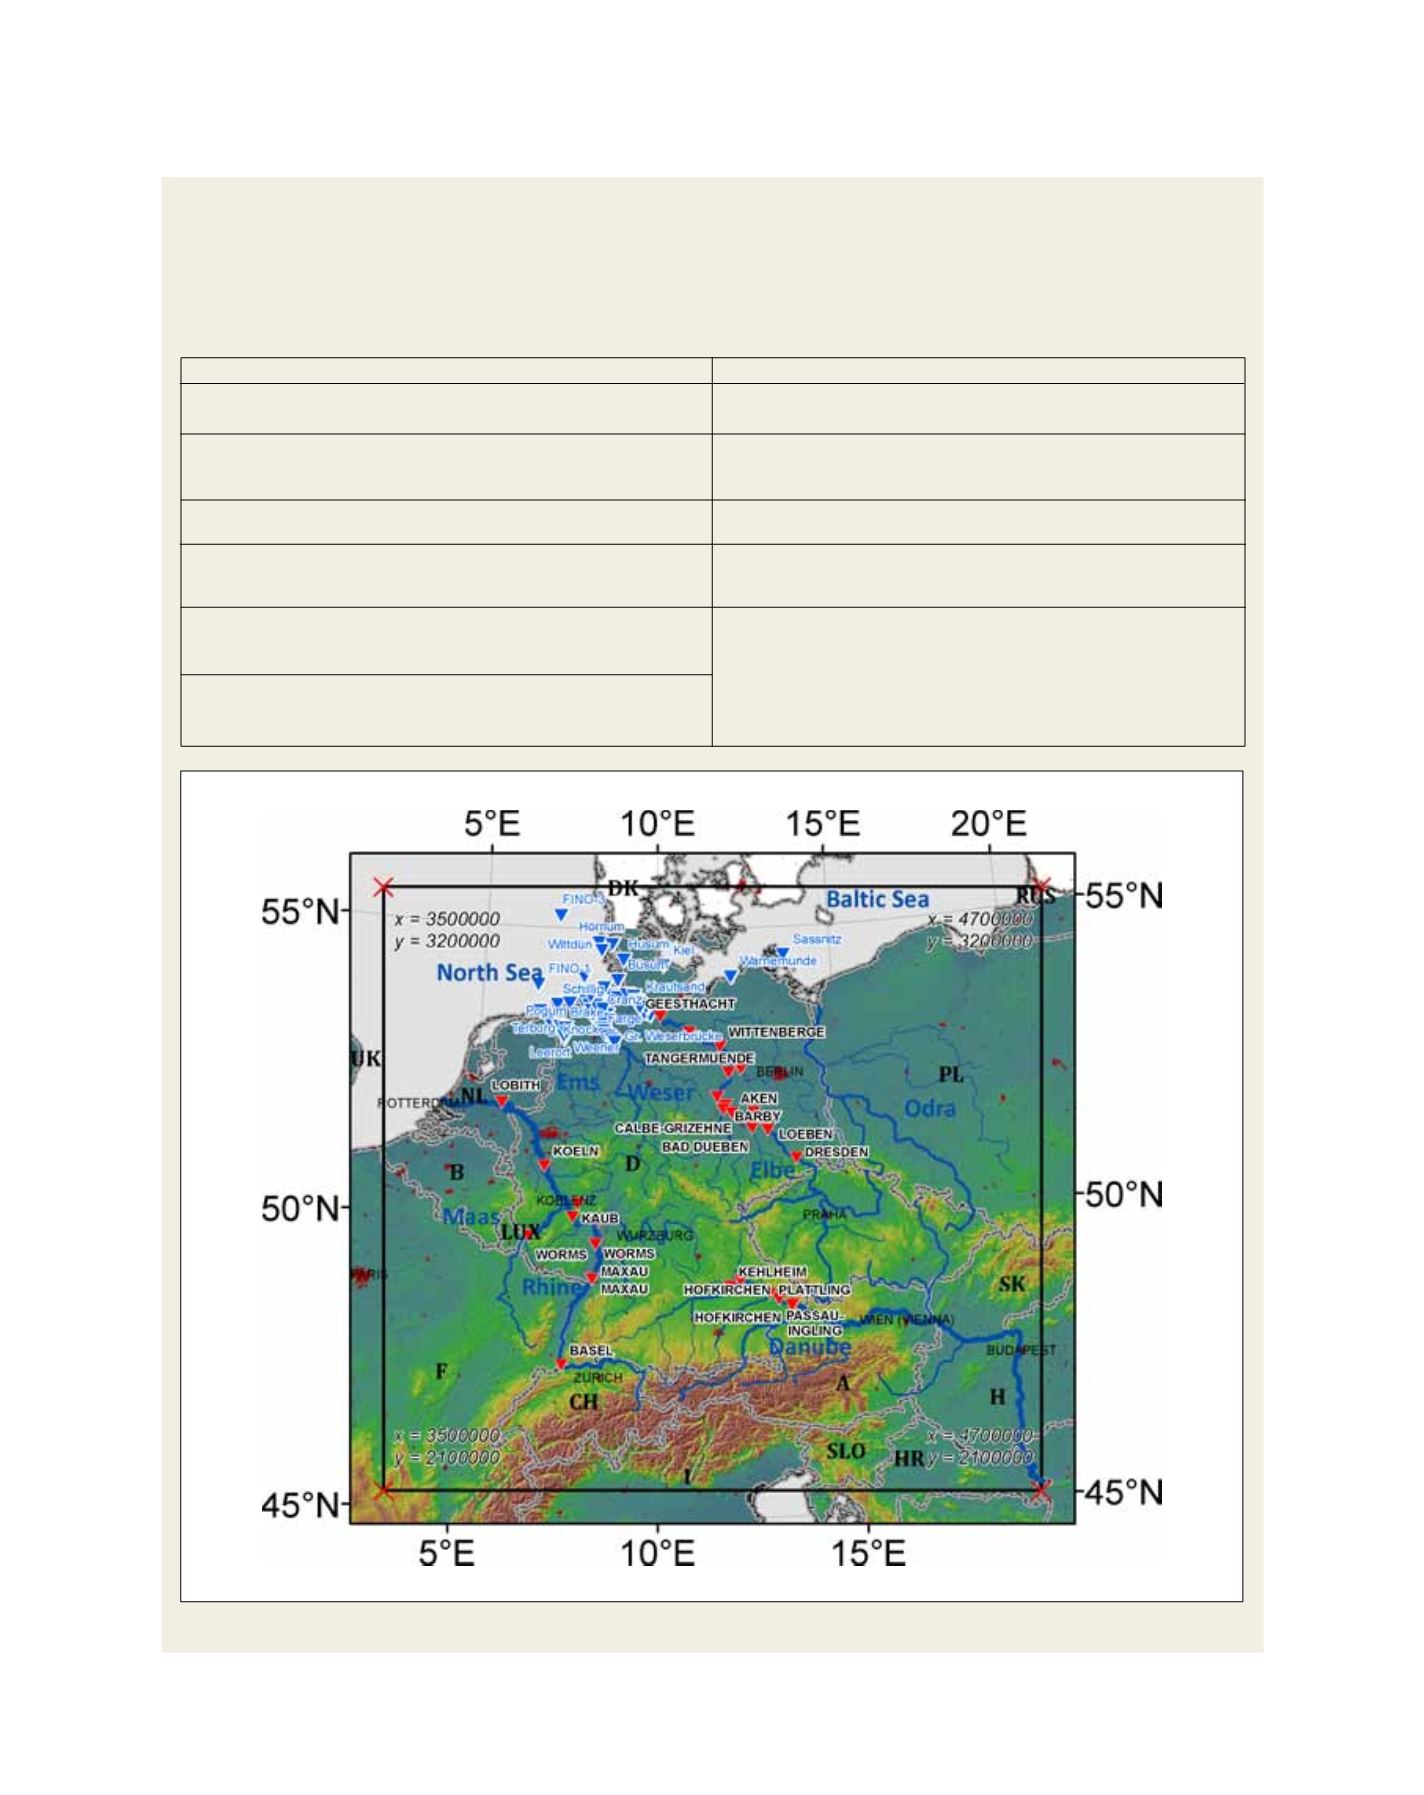
1990, 2021-2050, and 2071-2100 (minimum choice). The reference gauges stations for the evaluation are shown in the figure below.
Subset of the statistical values chosen for the evaluation of hydrological models and changes in inland and coastal regions
Reference gauges on the rivers Rhine, Danube and Elbe (red triangles) and the coastal regions (blue triangles)