


 89 / 288

[
] 90
W
ater
A steering group is monitoring, evaluating and readjusting the
service where needed. Decisions at the operational level are made
by the responsible project managers together with the users of
the services and scientific partners.
Data and models
The meteorological and hydrological data and models of KLIWAS
are linked in a complex model chain which mimics the complex
structure of the system under investigation, namely the major
river systems and the coastal areas of Germany and the neigh-
bouring countries. At each link of the chain, multiple models are
involved to give an idea of the uncertainty associated with each
modelling step.
In the framework of KLIWAS DWD acquires climate model
outputs of global and regional climate models from various
research groups. The model data are then further processed for
use in KLIWAS impact models. This post-processing includes the
verification of control runs, the statistical analysis of the climate
projections, further downscaling of regional climate model outputs
by means of statistical methods, and the bias correction of model
output. In addition, DWD compiles and generates meteorological
reference data sets for the entire basins of the international rivers
under investigation, as well as for the North Sea, the Baltic Sea, and
the adjacent North Atlantic. The reference data sets support the
verification of climate model data and KLIWAS impact models as,
hydrological models for example, and are used for bias correction
of climate model output.
At the BfG and the BSH the simulated and observed meteoro-
logical data are used as input for hydrological and oceanographic
models to assess the impacts of climate variability on stream
flows, sea level etc. The climate model data are bias-corrected
to be applicable in the impact models. Here too, multiple
correction methods are compared to demonstrate the specific
modifications of model results.
Methods and (hydrological) models are set up and/or evalu-
ated in cooperation with water research institutes and water
managers working on the same river basins as KLIWAS. All
institutions and persons bring in their own hydro-
logical expertise and data. For example, the model
used for short term forecasts is used in the same
version in Germany and the Netherlands. Thus, the
quality of the models and data is double-checked
and consistent across the border.
The KLIWAS programme does not end with infor-
mation on water quantity and hydrodynamics. It also
tailors specific information for different user groups.
For example, further models are coupled to assess
and monetize the effects of climate and hydrologi-
cal change on inland waterway transport. Specific
information on future transport costs and capacities
under climate change conditions are offered – includ-
ing an uncertainty statement. Using this information,
the users (for example, the BAW) evaluate adaptation
measures such as innovative steering techniques for
the vessels travelling on the River Rhine.
Example service: discharge scenarios for policy
development
As a consequence of the close stakeholder involvement,
information provided by KLIWAS is already in use in
policy development. For example, in 2010 KLIWAS and
network partners agreed on a general evaluation frame-
work designed to select and process climate model data
for the purpose of impact modelling.
3
This framework
consists in an agreed set of evaluation periods, evaluation
regions, and evaluation statistics as given in Appendix A.
This procedure resulted in a reduced ensemble (20 out
of 26 members) of bias-corrected climate simulations,
which are regarded as suitable for hydrological modelling.
On that basis, a set of hydrological indicators was gener-
ated, which characterises the potential future hydrological
regimes of the River Rhine in the middle and at the end of
the 21st century. The indicators were chosen to meet the
user needs that were identified; i.e. they indicate a span of
results for relevant hydrological statistics representing the
current modelling uncertainty as sampled by an ensemble
of quality-checked and bias-corrected climate simulations.
This work was coordinated, documented and published
online by the International Commission for the Hydrology
of the Rhine basin (CHR).
4
The hydrological statistics are
given in Appendix B. The bandwidth is characterized by
so-called scenario corridors. These corridors are defined
as clusters within the ensemble there where many projec-
tions produce similar values (Figure on page 91). They
represent the characterstics of the ensemble much better
than mean values or percentiles
These indicators were discussed by the International
Commission for the Protection of the Rhine (ICPR),
an advisory board that coordinates the work of repre-
sentatives of the governments of Switzerland, France,
Germany, Luxembourg, Netherlands and the European
Commission. Guidance on how to read the indicators
was given during specific workshops for representatives
dealing with floods, ecology, sediments and strategic
questions. In 2011, the ICPR members adopted the
indicators as scenarios to prepare the development of
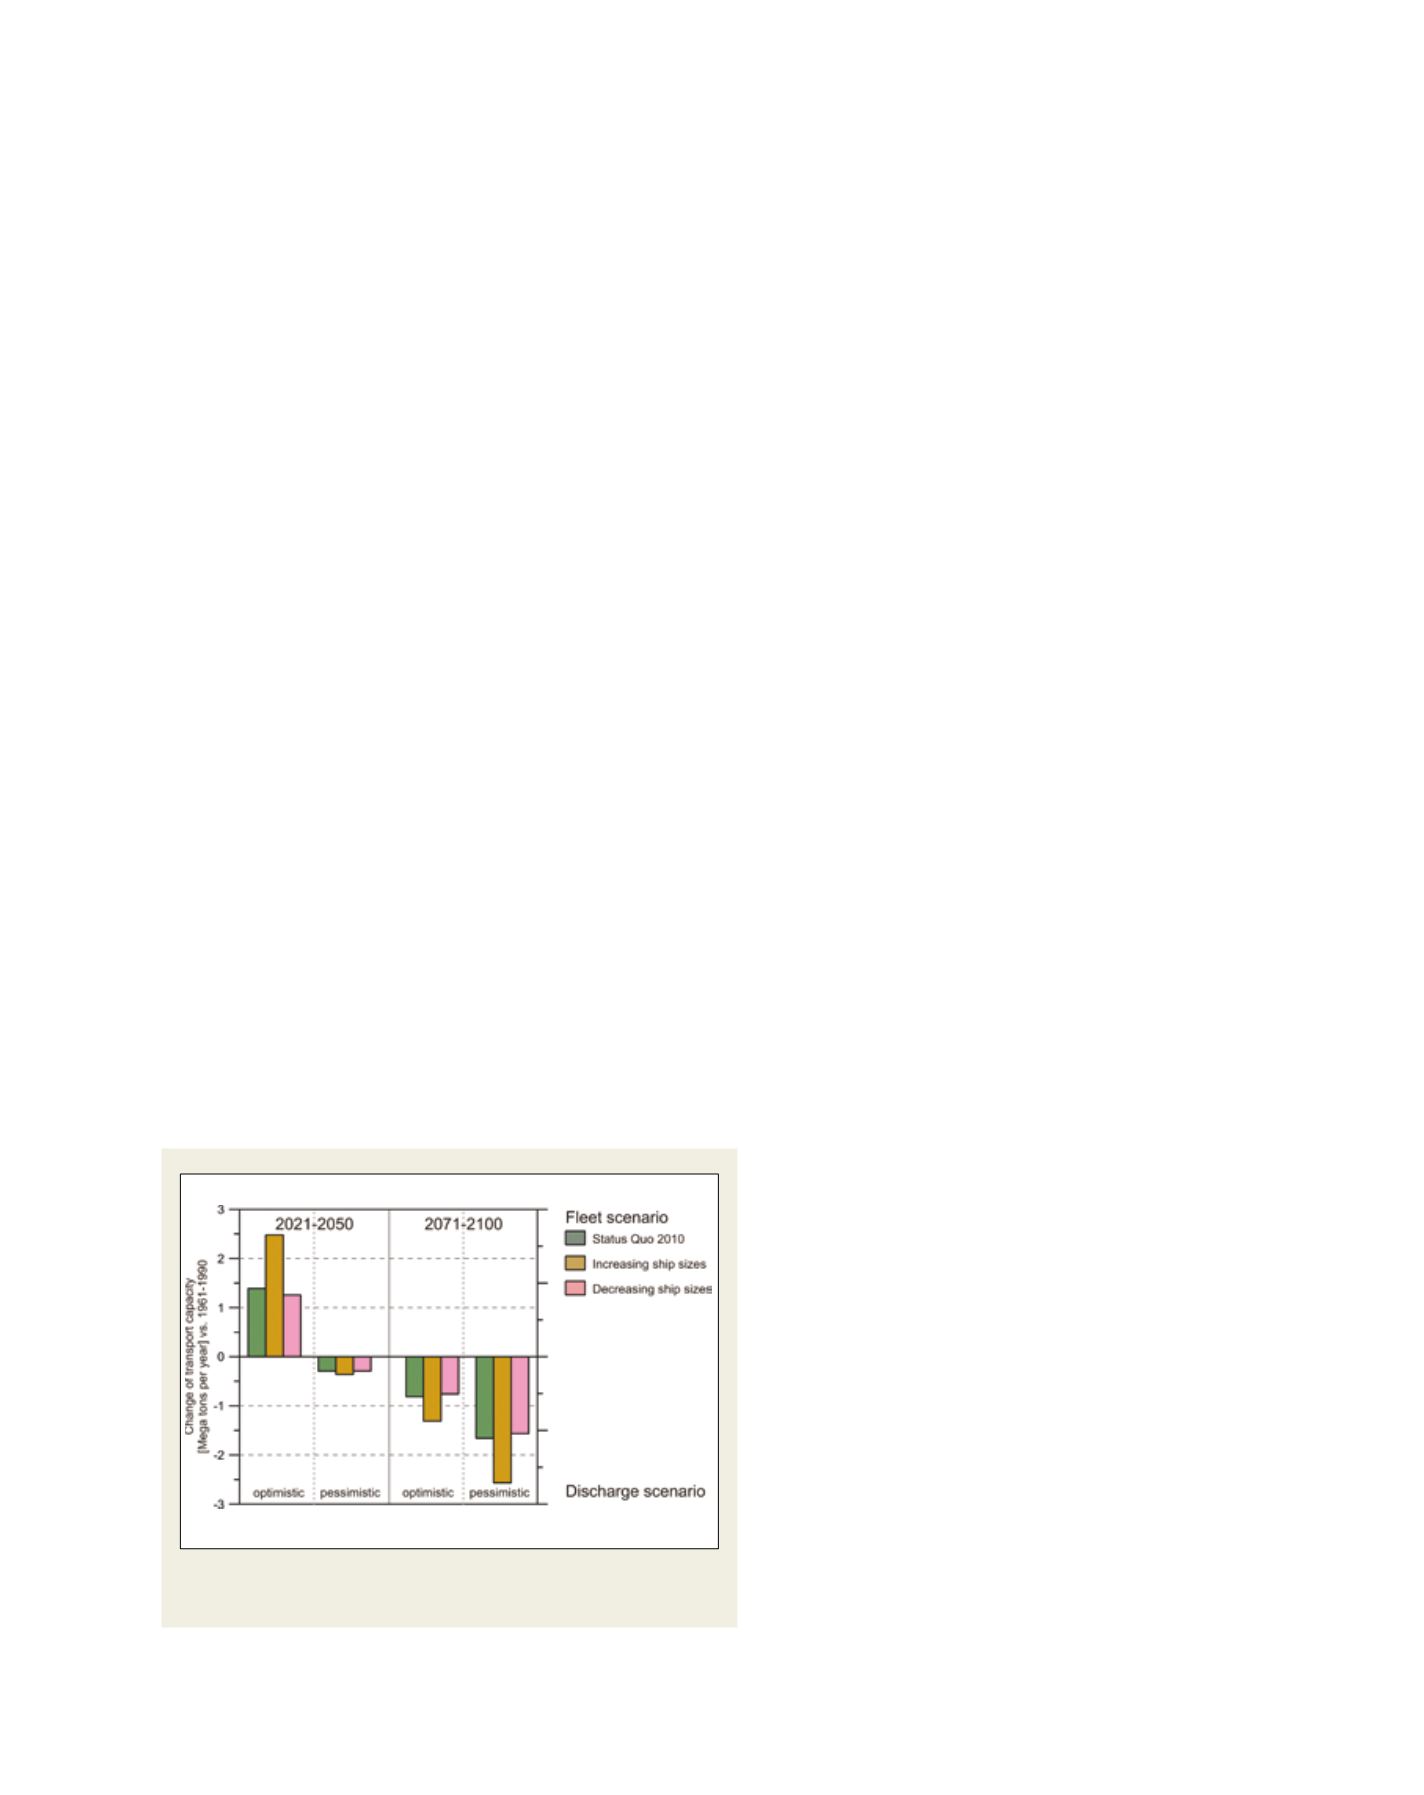
This graph on the effect of projected climate change on transport capacity of cargo
on the River Rhine is an example of user-specific information generated by KLIWAS
Source: Development Centre for Ship Technology and Transport Systems