


 85 / 288

[
] 86
W
ater
climate normals (running mean for optimal time periods),
3
and the exponentially-weighted moving average.
4
Root mean squared error is used to determine the
best trend fit to observations with the least error.
Analysis of ensemble information allows assessment
of mean climatological data and uncertainty due to the
trend fitting techniques.
Studies of the impacts of climate variability on local
extremes use compositing techniques applied to various
definitions of local variables, from specified percentiles
to critical thresholds. Drought studies combine the
visual capabilities of Google maps with statistical esti-
mates of drought severity indices. Climate studies for
water resources applications include:
• Current and expected maps of water resources
• Site-specific, interactive information on forecast
ensemble distribution for water resources and their
expected evolution
• Historical analogues of present and expected
river flow
• The relationship between water parameters and
climate variability indices.
NWS is leveraging internal and external NOAA partner-
ships to develop methodologies for the requirement on
the attribution of extreme meteorological and hydrologi-
cal events. This section of LCAT will include references
to explain the climatological drivers for extreme events
such as the 2010 heat wave and drought in Russia, the
2011 Missouri River flood and the unusually warm
March in the eastern USA in 2012.
The near-term development plan includes the incorpo-
ration of various climate variability indices such as North
Atlantic, Arctic, Madden Julian, Pacific Decadal and other
Present and near-term capabilities
NWS has identified five existing requirements for local climate
information:
• Local impacts of climate change
• Local impacts of climate variability
• Drought severity studies
• Climate studies for water resources
• Attribution of extreme meteorological and hydrological events.
The methodologies for the first four requirements have been
included in LCAT phase one implementation.
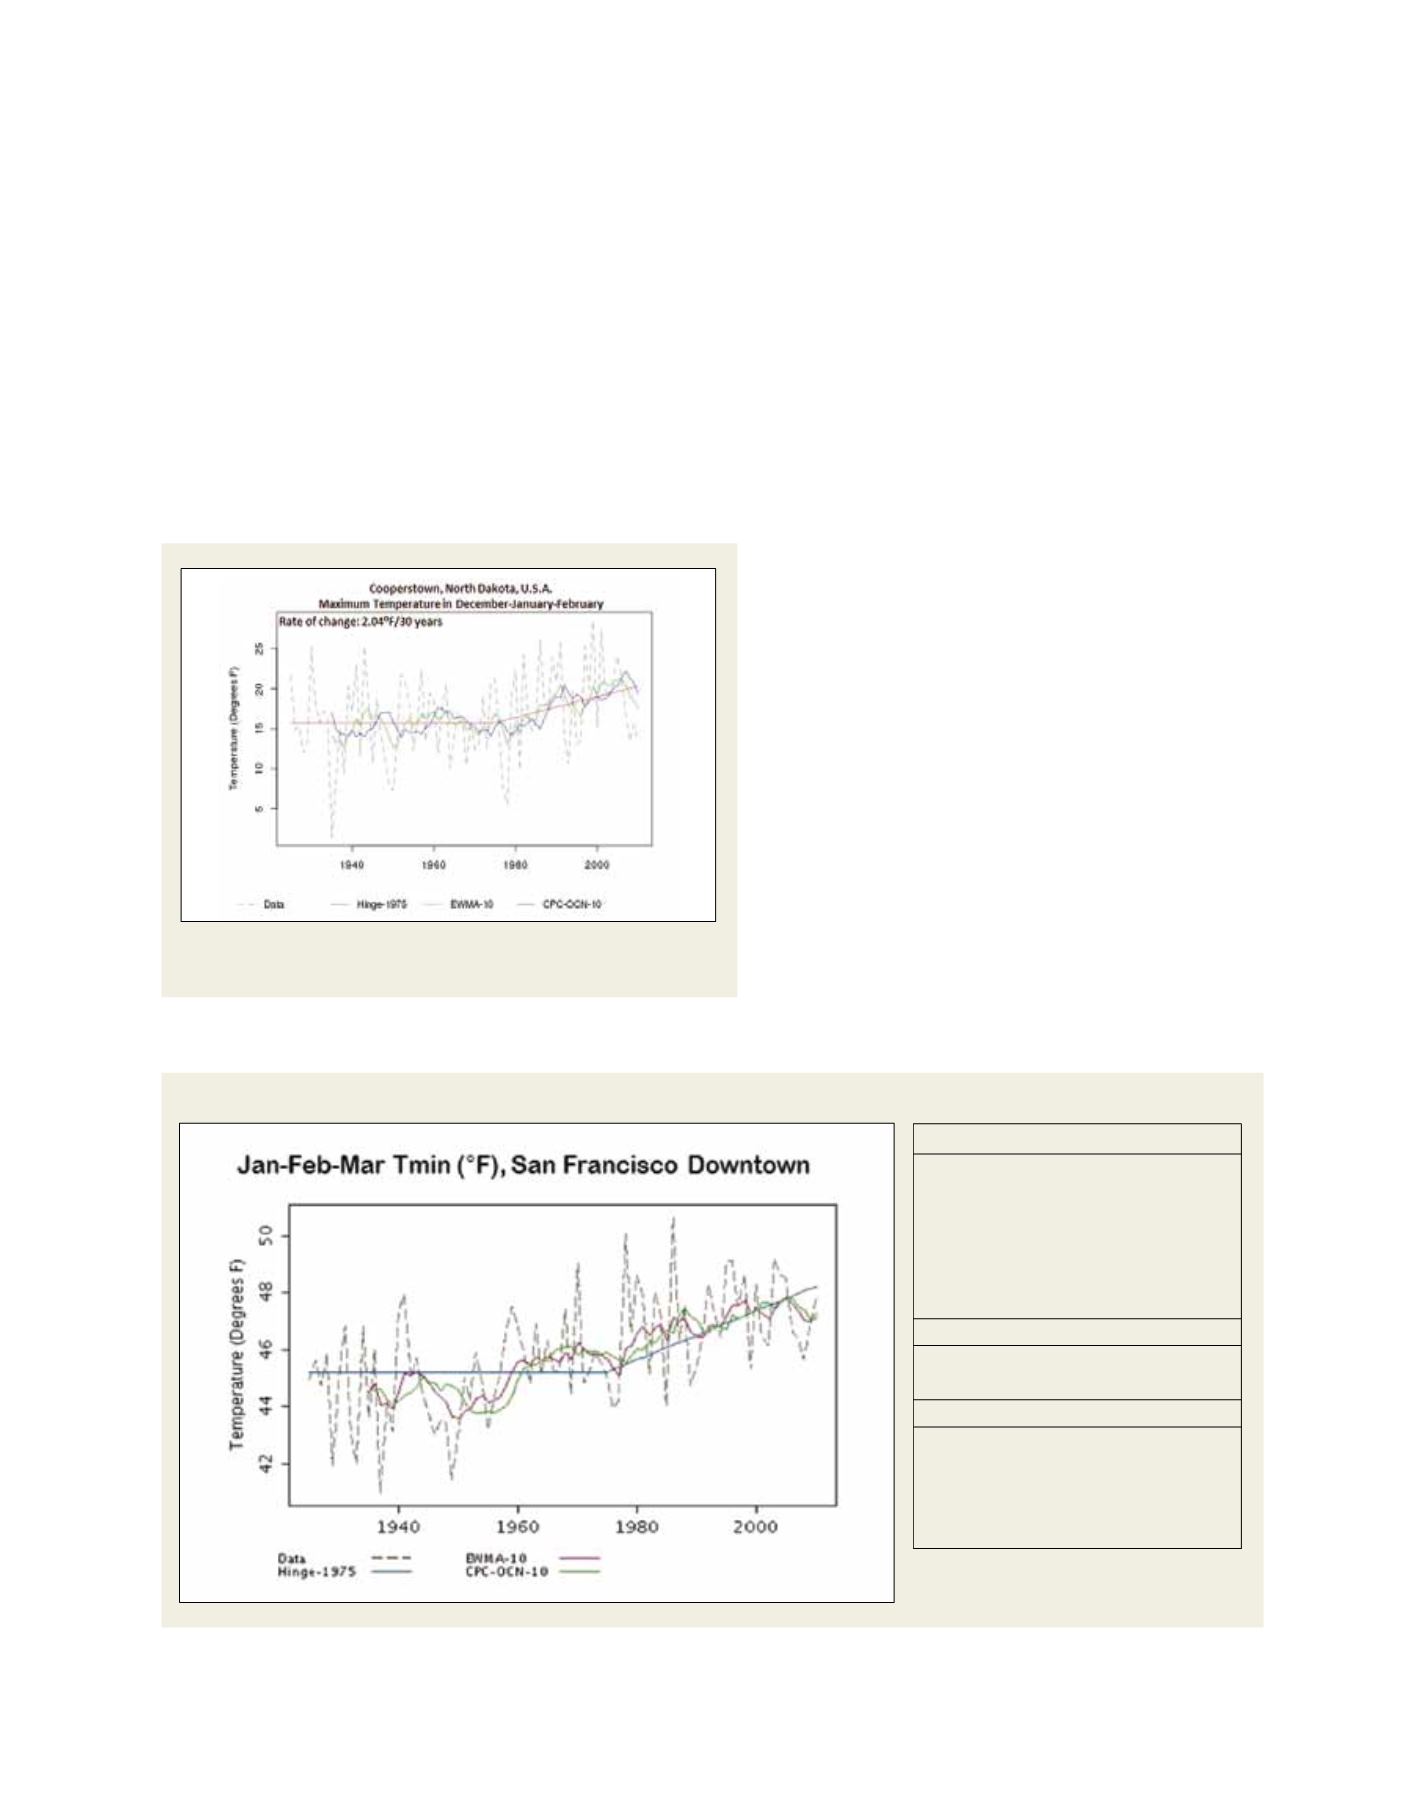
The local rate of climate change is defined as a slope of the mean trend
estimated from the ensemble of three trend techniques: hinge,
2
optimal
An LCAT local climate rate change analysis for minimum surface temperature in San Francisco, California
Source: NOAA
Trend Performance
Ensemble Performance
Root Mean Square Error
Hinge with anchor at 1975:
1.74
Exponentially Weighted Moving Average
1.39
(Alpha=10):
CPC Optimal Climate Normal
1.71
(10-Year MovingAverage):
Ensemble Standard Deviation 0.40
Rate of Change
Annual Rate of Change
0.047 Degrees F per year
Decadal Rate of Change 0.47 Degrees F per decade
Climatological Rate of
1.41 Degrees F per 30-year
Change
period
Source: NOAA
LCAT produces various trend analyses of time series and calculates the
rate of change for looking at the impacts of climate change at locations