


 86 / 288

[
] 87
W
ater
oscillations with documented impacts of weather and water parameters.
In addition, LCAT will have access to NOAA’s severe weather data sets,
which will enable climatological and impact studies of frequencies in
tornados, floods, snowstorms, heat waves, lightning and other extreme
events. For example, a pilot study analysed the relationship between
tornados and El Niño Southern Oscillation (ENSO) events, helping to
identify areas with significant tornados and an enhanced
number of tornado days during LaNiña events in the central
USA region. The plan also includes developing numerous
options for user-defined climate analysis, such as tuning to
strong climate events using multiple indices of climate vari-
ability and critical percentiles of data distributions. Plans
for LCAT include the capability to extend to existing data
visualization tools and to add options for three-dimensional
and multiple-site graphical capabilities.
Future goals and applications
Plans for LCAT include building the capability to extend
it to existing data visualization tools and adding options
for three-dimensional and multiple-site graphical capa-
bilities. Additionally, LCAT will be developed for climate
studies in key environmental and economic sectors. For
example, to support marine sanctuaries and coastal systems,
LCAT will have access to NOAA global sea level, tidal and
coastal surges monitoring data, which will enable climate
studies at specific harbours or marsh habitats. To support
renewable energy decisions, LCAT will use global surface
observation, satellite and reanalysis wind, cloud cover and
solar insulation data to allow the analysis of local clima-
tology at different heights of the atmosphere anywhere
on Earth. Extension to reanalysis data will enhance LCAT
global applications and enable the potential use of data from
Global Circulation Models for model inter-comparison on
regional scales. The LCAT development plan also includes
potential access to demographic and biological data to help
with holistic environmental climatological analysis.
User engagement
LCAT was beta tested by approximately 40 NOAA staff,
who were eager to start local climate studies. Several
training events took place to engage beta testers:
• Live webinars were recorded and provided to users
for further reference
• A training workshop was held, that included
instructions on using LCAT, information on data
and methods used for analy ses, practice sessions,
and discussions to collect user feedback
• Fact sheets were developed describing LCAT capabilities.
Feedback from beta testers identified new requirements to
be added to the tool prior to operational implementation
for internal use by NOAA. LCAT’s application for NOAA’s
external use requires the engagement of users and inte-
gration of new requirements. LCAT’s development is an
iterative process of user engagement that includes iden-
tifying user needs, formulating requirements and setting
priorities; coordinating with subject matter experts on best
practices for use of appropriate data and scientific methods
to respond to these needs; building and testing new LCAT
capabilities; training and user feedback.
This continuous development will ensure that LCAT
provides the analysis tools and capabilities to meet the
needs of a wide range of stakeholders, enabling the
interpretation and dissemination of climate data to
support climate-sensitive decisions.
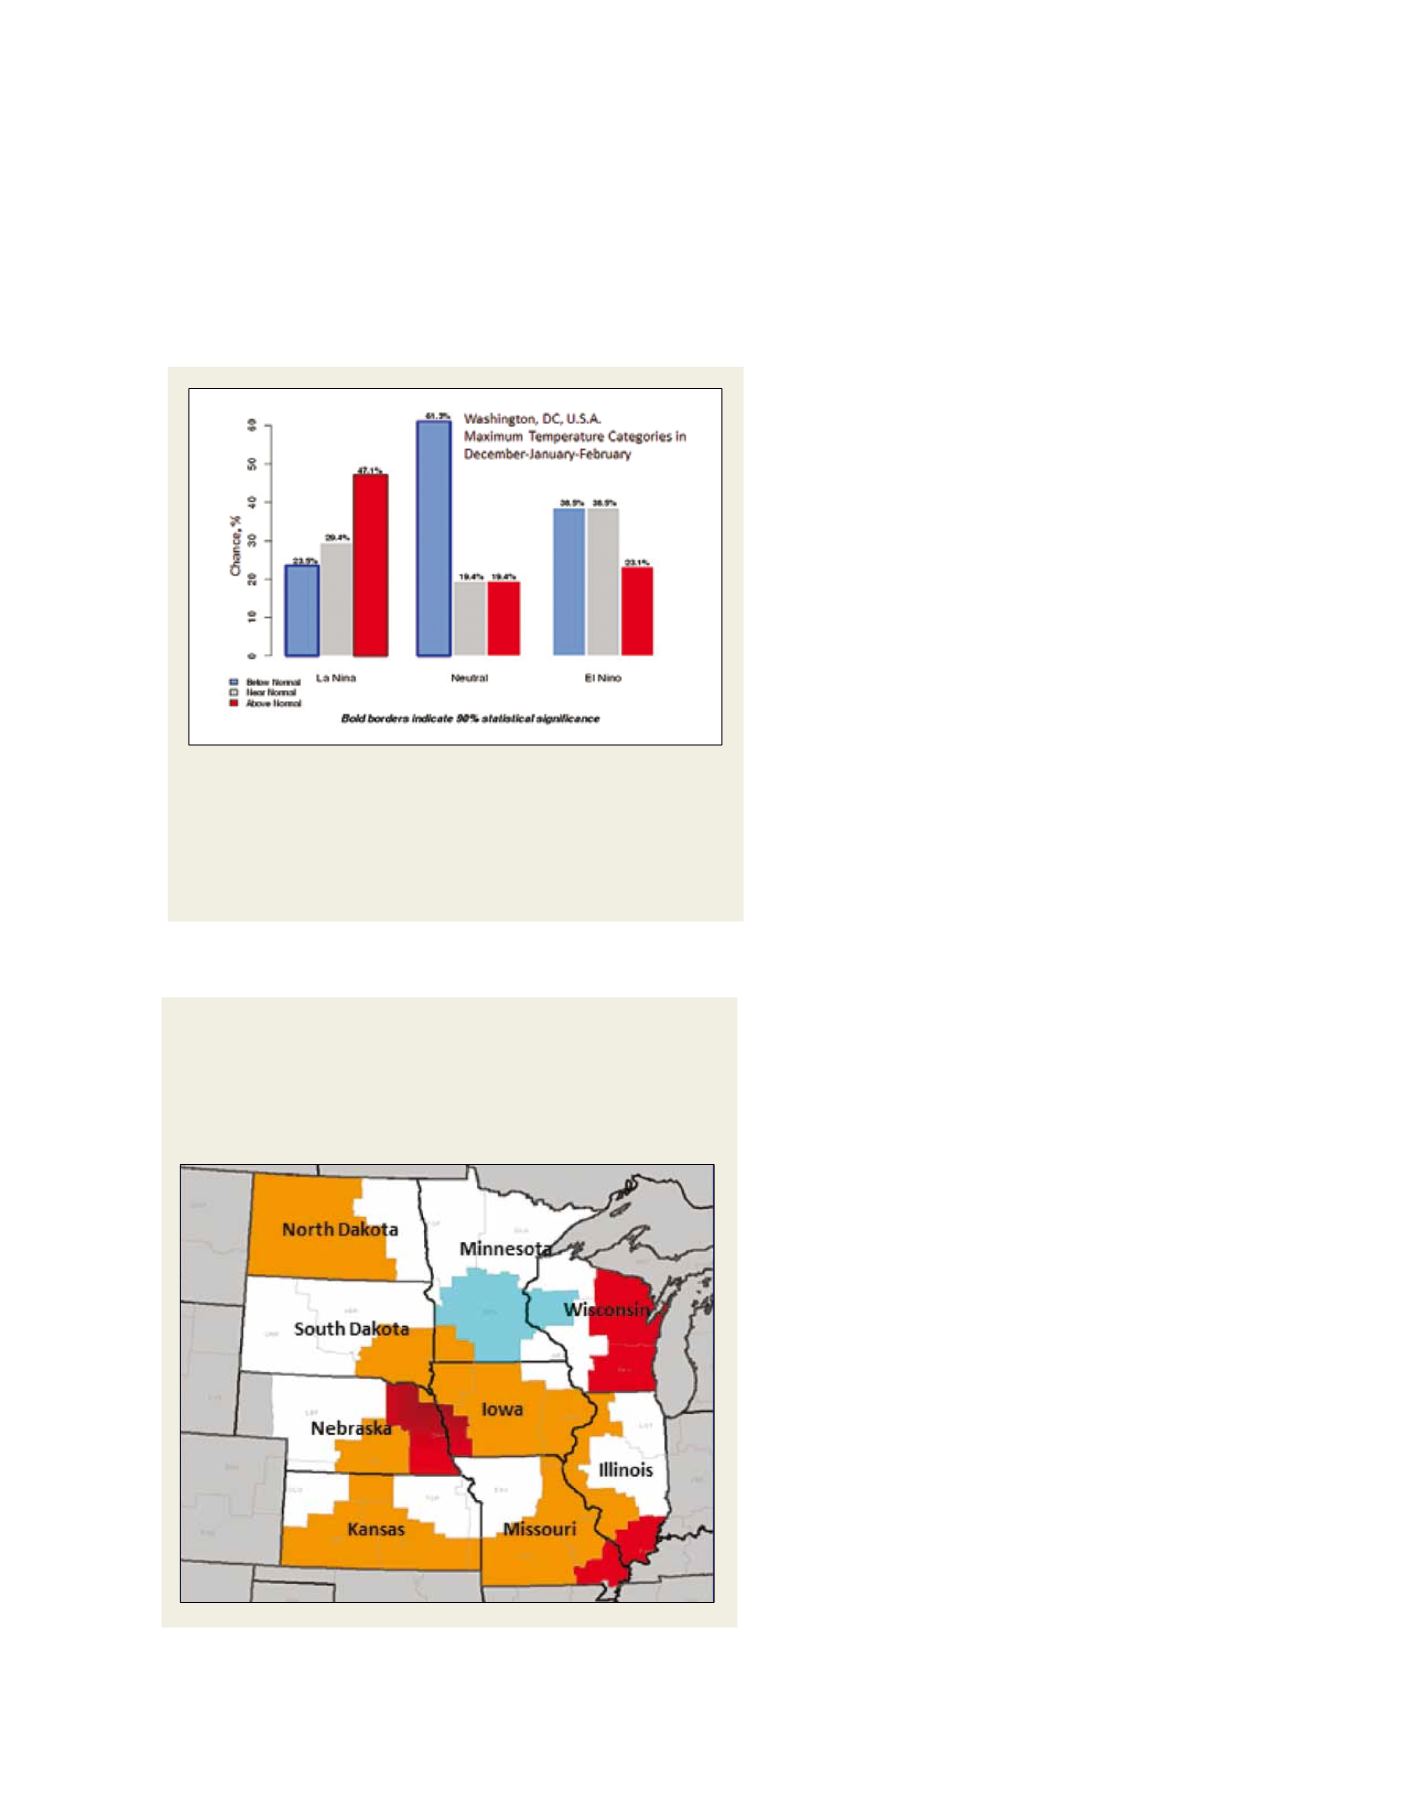
Results of a pilot study that helps to identify areas with
significant tornados and enhanced numbers of tornado
days during La Niña events in the central USA
Orange: Area with enhanced significant tornados
Cyan: Area with diminished significant tornados
Red: Area with enhanced number of tornados days
Source: NOAA
Source: NOAA
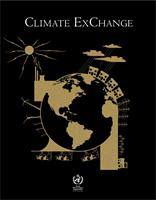
For looking at the impacts of climate variability, LCAT examines the
relationship between climate phenomena such as El Niño Southern
Oscillation and local climate variables. This example shows a statistically
significant chance (bold border) for above normal maximum temperature
during La Niña events. The temperature categories are defined using a
climatological reference period of 1981-2010.