


 223 / 287

[
] 224
R
isk
G
oveRnance
and
M
anaGeMent
and databases of various hydrometeorological hazards along
with trends and documentation on historical high impact
events. Events included extreme heat and cold, drought,
extreme rainfall, blizzards, hurricanes, ice storms, torna-
does, wind storms, smog, and ultraviolet radiation. Hazards
information included analyses on frequencies for selected
periods of record, average days per year with conditions
exceeding thresholds, extreme precipitation and tempera-
ture records, probabilities of an event at a location, most
recent occurrences of extremes, return period estimates and
climatic design values for engineering, as well as weather
warning criteria and potential impacts of specific hazards.
7
A challenge in designing hazards information is the need
to satisfy a wide variety of users ranging from the well
trained planner to the less experienced user, while balancing
requirements for accuracy and comprehensiveness. Precise
information is of little value if it cannot be understood in
a rural municipality by the clerk with responsibilities for
disaster management planning. Likewise, information that
is so highly simplified that it does not accurately convey the
actual threat is inadequate for the professional consulting
firmhired to advise another municipality of risks and priori-
ties. The challenge is to communicate complex scientific
information simply to all users and to ensure that informa-
tion is scientifically defensible.
Infrastructure protection and disaster risk reduction
Experience has shown that the house can be the first line
of defence against hazards. Forensic analyses often reveal
that structural failures of infrastructure (houses, electrical
distribution lines, communications structures, dams) result
when climate extremes approach the structure’s critical
design values and safety limits.
8
Above critical thresholds,
small increases in weather and climate extremes have the
potential to bring large increases in damage, even though
the high-impact storms associated with this damage may
not bemuchmore severe than those which occur regularly.
9
In many cases, it is likely that the critical thresholds reflect
storm intensities that exceed average design conditions for a
variety of structures of varying ages and conditions.
An investigation of claims by the Insurance Australia
Group indicated that a 25 per cent increase in peak wind
gust strength above a critical threshold can generate a 650
per cent increase in building claims.
10
Similar studies indi-
cate that, once gusts reach or exceed a certain level, entire
roof sections of buildings are often blown off or additional
damage is caused by falling trees. Typically, minimal
damage occurs below this threshold.
11
Similar results
have been obtained for flood and hailstone damage.
12
Not
surprisingly, the quality of construction strongly influences
the extent of damage.
Climatic design values used in building codes and stand-
ards for the design of reliable and economical infrastructure
include quantities such as the 10, 50 or 100-year return
period ‘worst storm’ wind speed, rainfall or snow condi-
tions and are typically derived from historical climate data.
Almost all existing infrastructure has been designed based
on the assumption that the past will represent conditions
over the future lifespan of the structure. This will hold less
the threats we face, we are better able to prepare for them”. Although
natural disasters are not always predictable, they are usually foresee-
able, meaning that they can be risk managed beforehand. Many natural
hazards can be anticipated using past experience, climatological analyses
of atmospheric hazards, analysis of vulnerabilities, forensic analyses and
guidance on future climates.
A significant part of risk management planning involves a vulner-
ability or hazard identification and risk assessment (HIRA) process that
integrates the probability of hazards with community critical infrastruc-
ture vulnerabilities and risk assessments. For example, the province of
Ontario in Canada passed legislation in 2003 requiring that all of its
municipal and regional governments identify and prioritize their top
ten hazards and risks to public safety.
3
Because capacity varied greatly
among municipalities, the process used a simplified system to evaluate
hazards, as well as the municipality’s response capability. The Ontario
HIRA system
4
ranked hazards and risks as follows:
• Frequency or probability, ranked from one to four, where one reflects
a low occurrence and four a high occurrence (within the past 15
years)
• Impacts or consequences, ranked from one, negligible, to four, high.
Degree of impact can be determined through consultation with
experts. A high score reflects a likelihood of severe consequences,
including fatalities and the loss of essential infrastructure and services
• Community response capability or adaptive capacity (optional).
These are ranked from one, excellent, to four, poor, and can modify
the assessment of impacts for low probability but high-impact events,
where response experience and capacity may be limited.
In support of this system, Environment Canada developed an
Atmospheric Hazards website
5
for regional emergency managers.
6
The
website and publications included peer-reviewed or ‘authoritative’ infor-
mation on hazard probability and provided tools for spatial and temporal
comparison across regions. Information consisted of ‘defensible’ maps
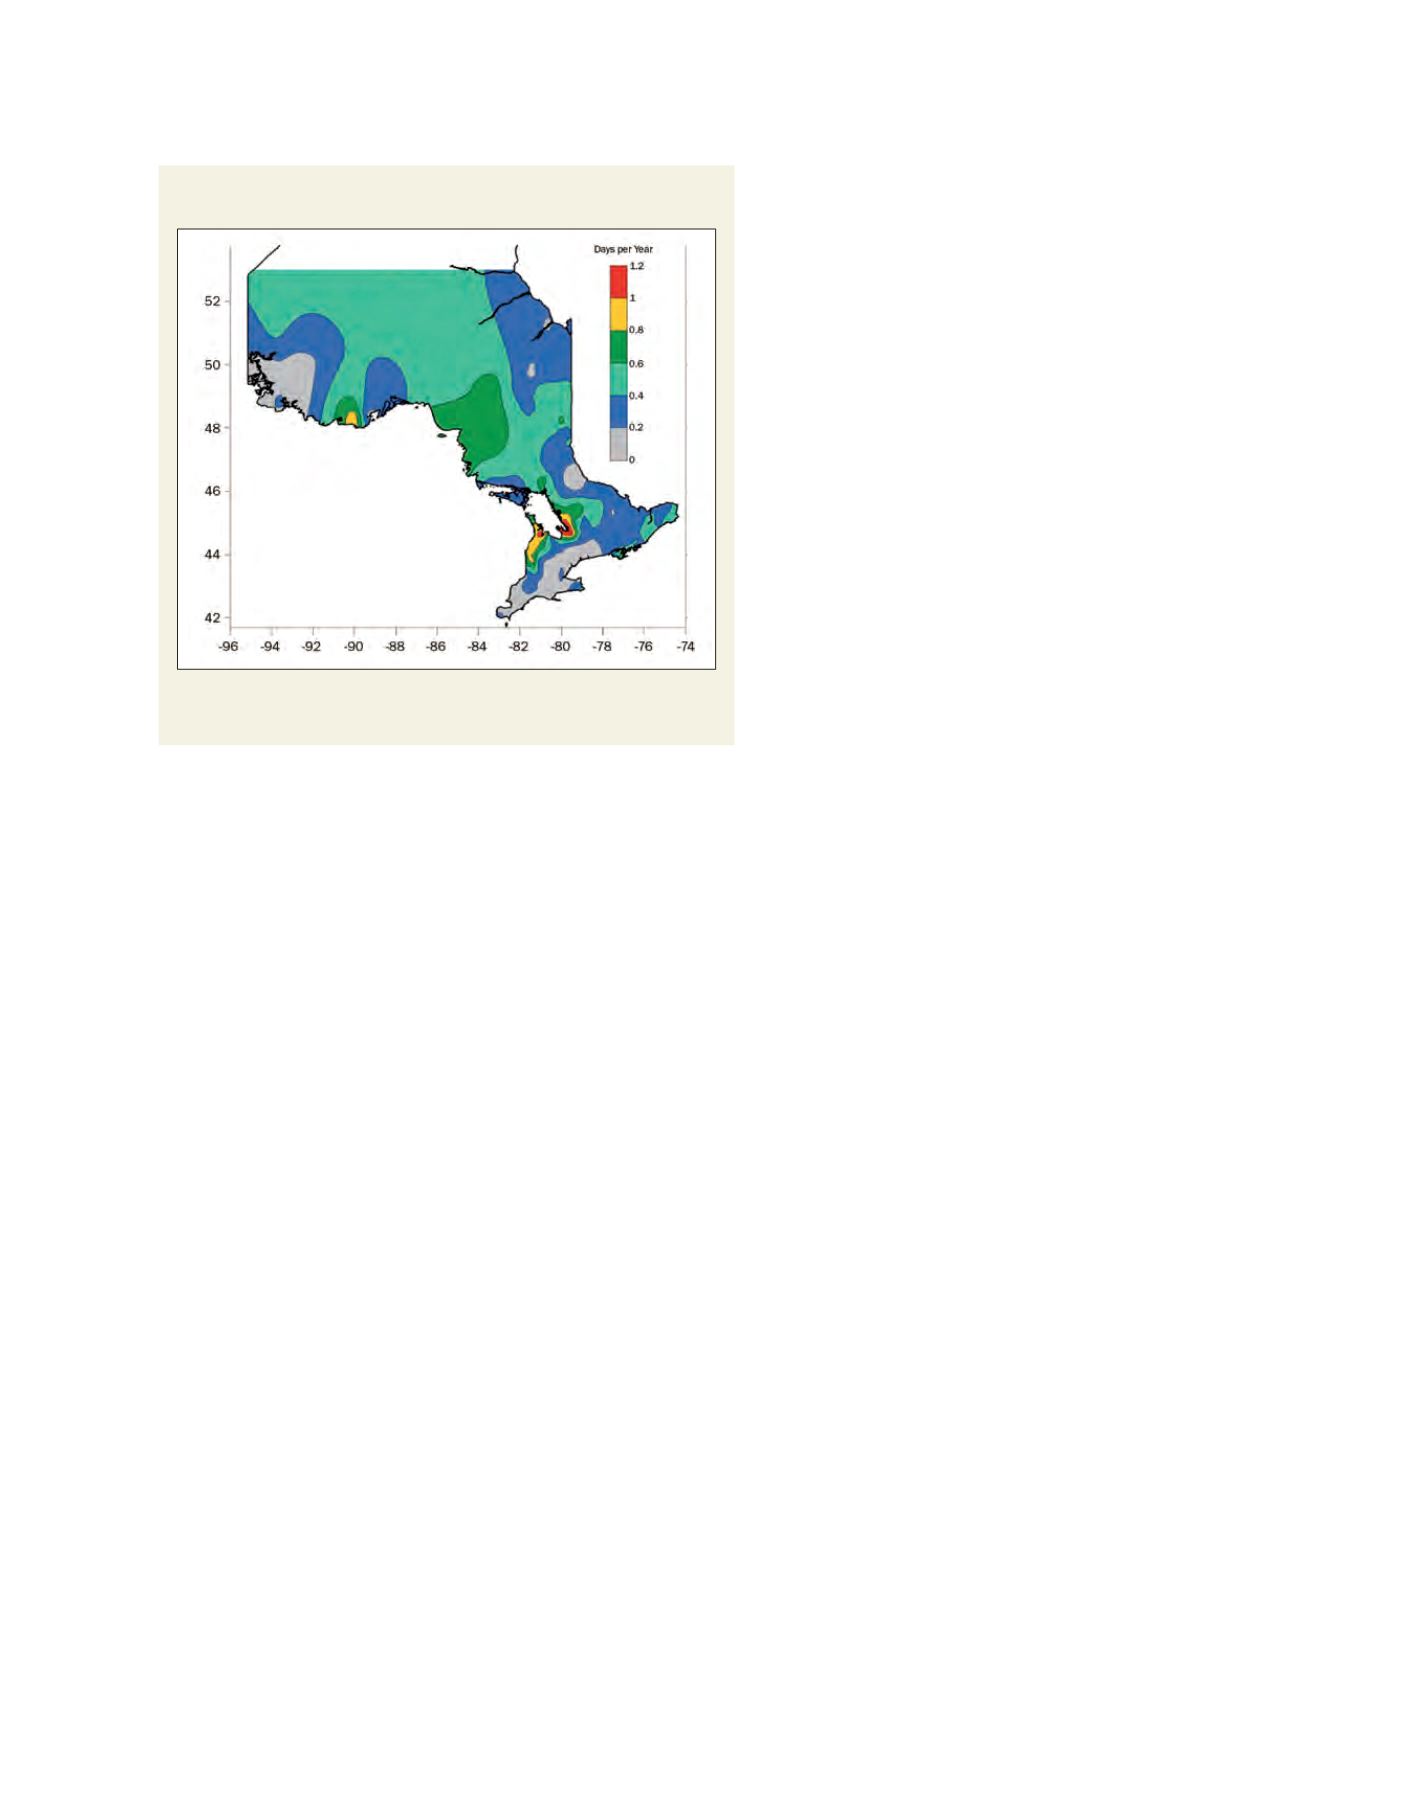
Numbers on the left side of image are degrees latitude North (42 to 52), and
numbers on bottom of image are degrees longititude West (-74 to -96)
Source: Auld, 2008(a)
Average number of days per year with daily snowfall >= 25
centimetres, based on data 1971-2000