


 45 / 287

[
] 46
T
he
I
mpacts
and
I
mplications
of
C
limate
C
hange
and
V
ariability
transport generated around 75 per cent, with approximately 40 per
cent being caused by air transport alone. CO
2
is not the only cause of
climate change, with other GHGs and the ‘radiative effect’ also making
significant contributions to global warming. There are however wide
discrepancies in calculations of their impact on climate change.
Mitigation policies and measures
Continued growth of tourism-related emissions is projected under
‘business-as-usual’ conditions, so mitigation policies are vital for the
industry. Such policies need to consider several dimensions including:
the need to stabilize the global climate; people’s right to rest, recovery
and leisure; and the United Nations Millennium Development Goals.
Climate change mitigation relates to technological, economic
and socio-cultural changes that can lead to reductions in GHG
emissions. As the reductions required from tourism to contrib-
ute meaningfully to the broader emission reduction targets of the
international community are substantial, mitigation should ideally
combine various strategies – such as voluntary, economic and regu-
latory instruments. These can be targeted at different stakeholder
groups including: tourists; tour operators; accommodation managers;
airlines; manufacturers of cars and aircraft; and destination manag-
ers. Instruments could also be applied with different emphasis in
different countries, so as not to jeopardize the opportunity to reduce
poverty offered by tourism in developing countries.
It is possible to distinguish four major mitigation strategies for
addressing GHG emissions from tourism:
Reducing energy use
– One of the most essential aspects of mitigation.
It can be achieved by changing destination development and manage-
ment practices, as well as altering transport mode (for
example, more use of public transport, or shifting from car
and aircraft to rail and coach). Tour operators can play a key
role in this process, as they bundle products and can have
considerable influence on demand for less carbon intensive
journeys by creating attractive products that meet tourists’
needs and desires. UNWTOhosts the secretariat of the Tour
Operators’ Initiative for Sustainable TourismDevelopment,
which seeks, among other objectives, to encourage initia-
tives and efforts to achieve sustainable development across
all sectors of the tourism industry.
Improving energy efficiency
– The use of new and
innovative technology can significantly reduce emis-
sions and energy demand.
Increasing the use of renewable energy
– The substi-
tution of fossil fuels with renewable energy sources is
particularly important for island destinations, where
energy supply based on fossil fuels is expensive and at
risk of supply interruption.
Sequestering CO
2
through carbon sinks
– Within the
tourism industry this is currently practiced through
carbon compensation or carbon offsetting, which means
that an amount of GHG emissions equal to that caused
by a certain activity will be reduced elsewhere (for
example, through reforestation).
11
In order to estimate how emission pathways in the
global tourism sector might develop in the future, a team of
experts has developed several scenarios considering differ-
ent mitigation options. The ‘business-as-usual’ scenario
(which takes into account the UNWTO’s Tourism 2020
Vision forecast of an average 4 per cent annual growth of
international tourist arrivals up to 2020) predicted that
CO
2
emissions in the global tourism sector will experience
a growth of 161 per cent by 2035. If the maximum possible
Estimated emissions from global tourism in 2005,
including international and domestic tourist trips, as
well as same-day visitors
Source: UNWTO, UNEP and WMO (2008)
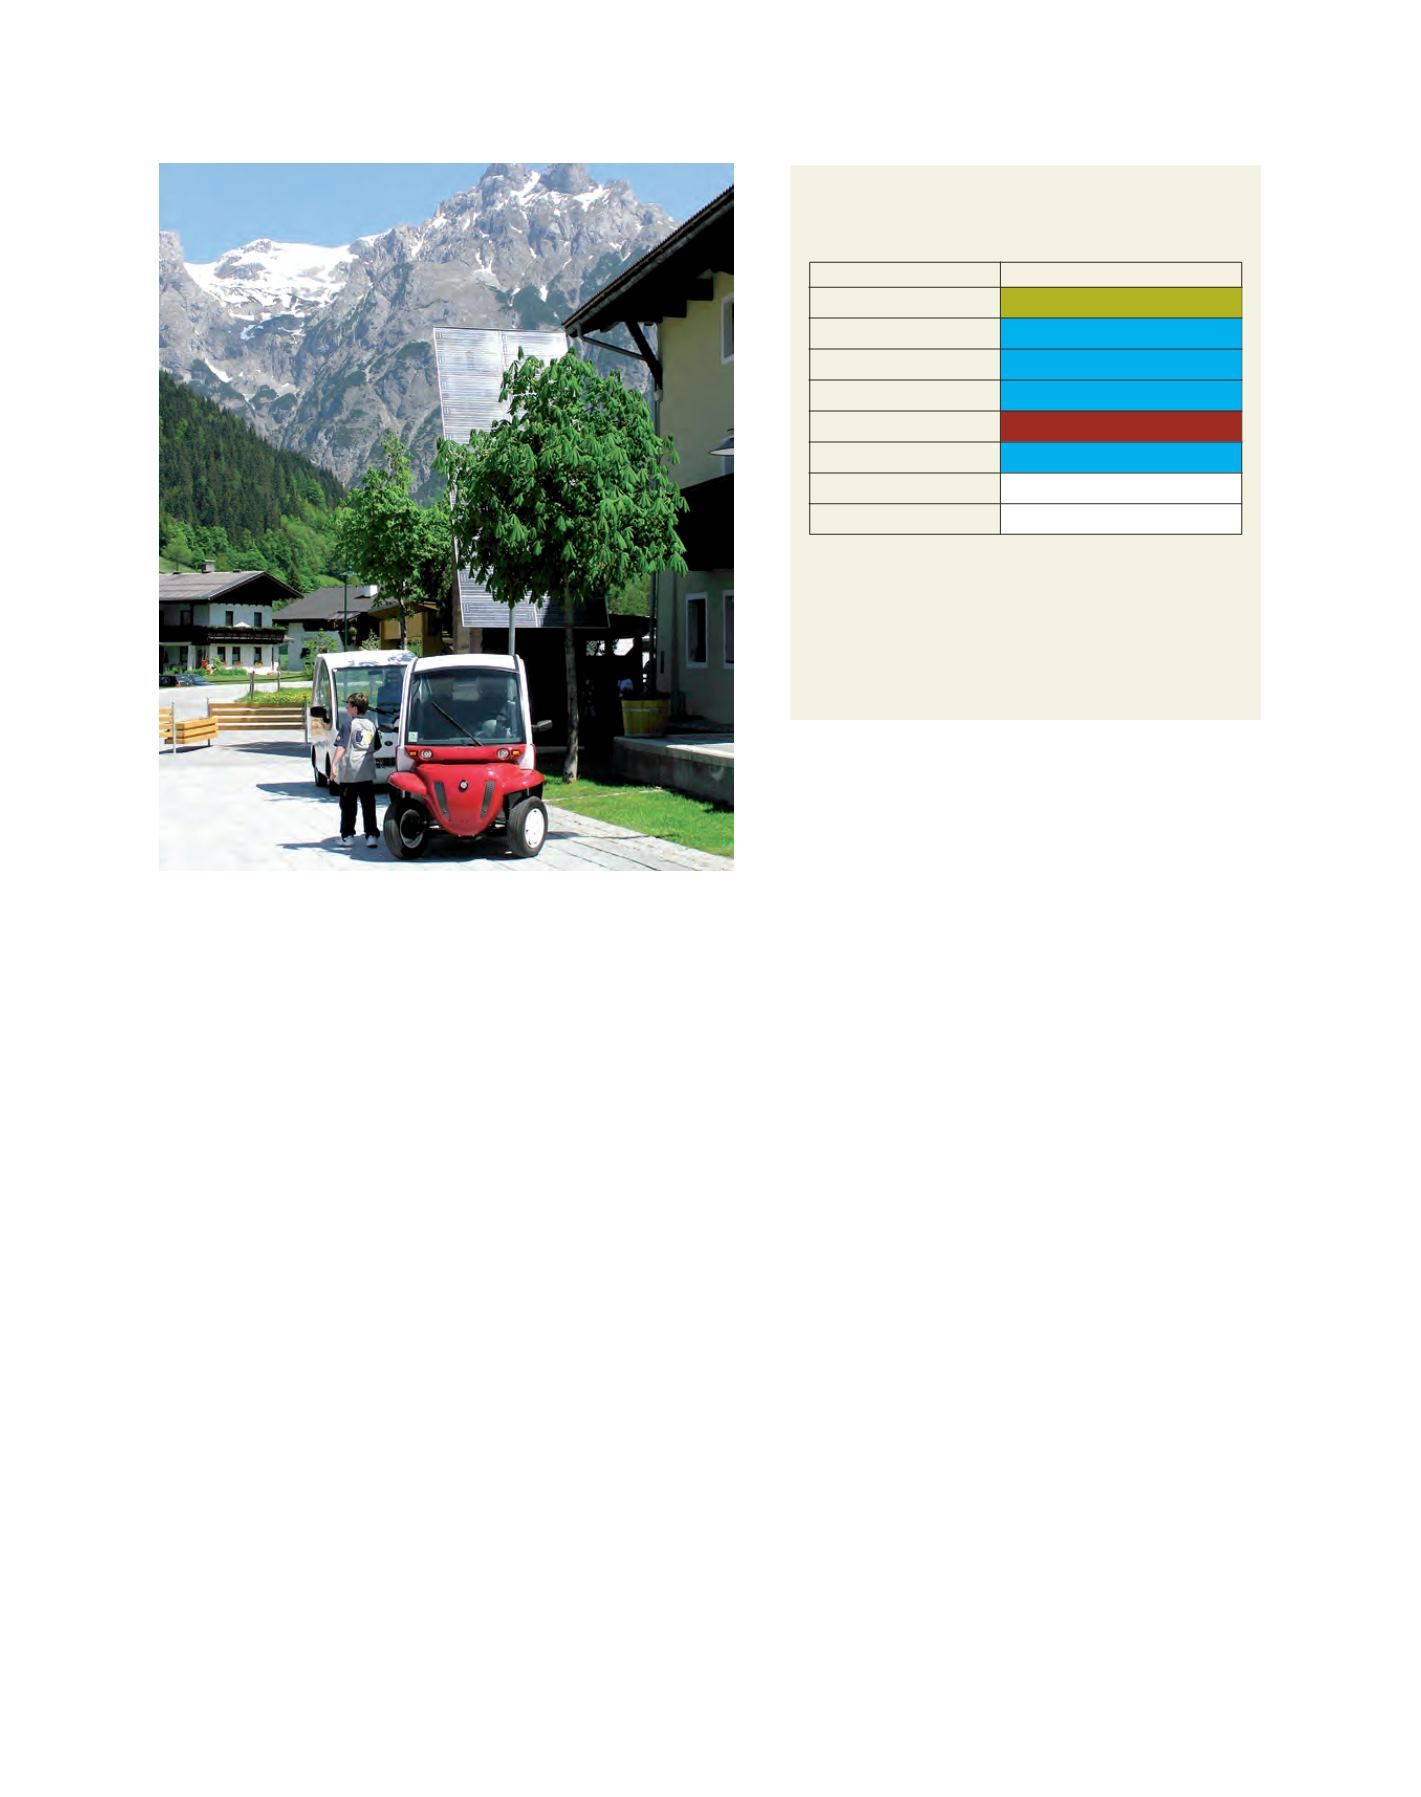
Electric vehicle fleet for tourists in Werfenweng, Austria
Image: Scott, D
Colours represent the degree of certainty with respect to the
data and underlying assumptions. Green represents a degree
of uncertainty of +/-10 per cent, blue +/-25 per cent and red
+100 per cent/-50 per cent. ‘Total world’ indicates annual
fossil carbon dioxide emissions (including those from cement
production), according to IPCC, The Physical Science Basis
Air transport
Car
Other transport
Accommodation
Activities
TOTAL
Total world
Share (%)
CO
2
(Mt)
515
420
45
274
48
1,302
26,400
4.9