


 45 / 208

[
] 45
an online public records system, featuring information on records
of property details, tax collection, births and deaths has trans-
formed the village. Its implementation has drastically reduced
corruption and red tape. Bellandur is credited with being the
first village-level administration to introduce e-governance in
India in 2002. The computerization of public records has helped
speed up tax collection and property transfers. The project has
also helped recover large amounts of outstanding revenue for
new community projects such as roads, underground drainage
systems and wells.
In the Philippines, the city of Naga won the Dubai
International Award for Best Practices. Naga’s e-governance
initiative is a “people-driven” programme that promotes trans-
parency, accountability, public participation to enhance
governance processes, local service delivery and the standard
of living.
7
The programme uses various ICT tools such as the
Internet and text messaging to deliver information to its citi-
zens. The Naga City People’s Council (NCPC) and a local
federation of approximately 100 non-government and people’s
organizations in the city run the system. Since its inception, the
initiative has sought to involve the least privileged and most
vulnerable sectors of society. By promoting transparency in local
city management it has brought annual savings into city coffers
amounting to at least ten million pesos or USD180 000 per year.
By raising awareness on performance standards, it has allowed
Naga to “do more with less”. With almost no budget increase,
streamlined processes and adherence to cost standards have
enabled Naga council to meet growing demands for services to
the poor, such as a 10 per cent annual rise in the number of
city hospital patients; and a 7.7 per cent increase in yearly enrol-
ment in the public school system.
8
Besides bringing the urban poor closer to the decision making
processes that concern them most, modern technology is also
crucial to good urban policy and planning – especially where it
requires accurate information on the size of a city, its streets, the
number of households, water connections, public transport and
other important aspects of everyday city life. Indeed, many
municipalities around the world simply do not have an accurate
idea of where slums begin and end, or how much lighting is
provided along a back street, or which roads are in need of repair.
It is here that UN-HABITAT’s Urban Indicators Programme and
the Global Urban Observatory (GUO) come in. The agency uses
Geographic Information Systems (GIS) to show how satellite
photographs taken from space can be used to tackle such problems.
Using simple software, these images can give a city mayor or a town
water engineer not only snapshots of the town, but a bird’s eye view
of a single neighbourhood or even a street. If they are doing a head
count, or checking electricity supplies, a team is sent in to do a
survey on the ground. This then enables those using GIS software
to fill in blanks and produce a simple, highly cost-effective map of
any given situation. Through the 1 000 Cities GIS Programme, UN-
HABITAT in partnership with the developer of Geographical
Information System (ESRI) distributes free software and training
packages to municipalities around the world. Around 160 cities
throughout the world have already benefited from the project.
9
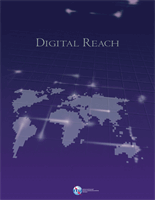
The city of Curitiba in Brazil uses GIS technology to help
provide indicators so that elected city officials gain a good under-
standing of the complexity of urban migration, foreseeing growth
trends and planning.
10
UN-HABITAT also supports the six urban observatories run by
the Third World Environment and Development Relay for
Participatory Urban Development (ENDA-RUP) in the French-
Photo of Curitiba in Brazil showing the contrast between the
low-income areas with the more affluent ones
Photo: UN-HABITAT
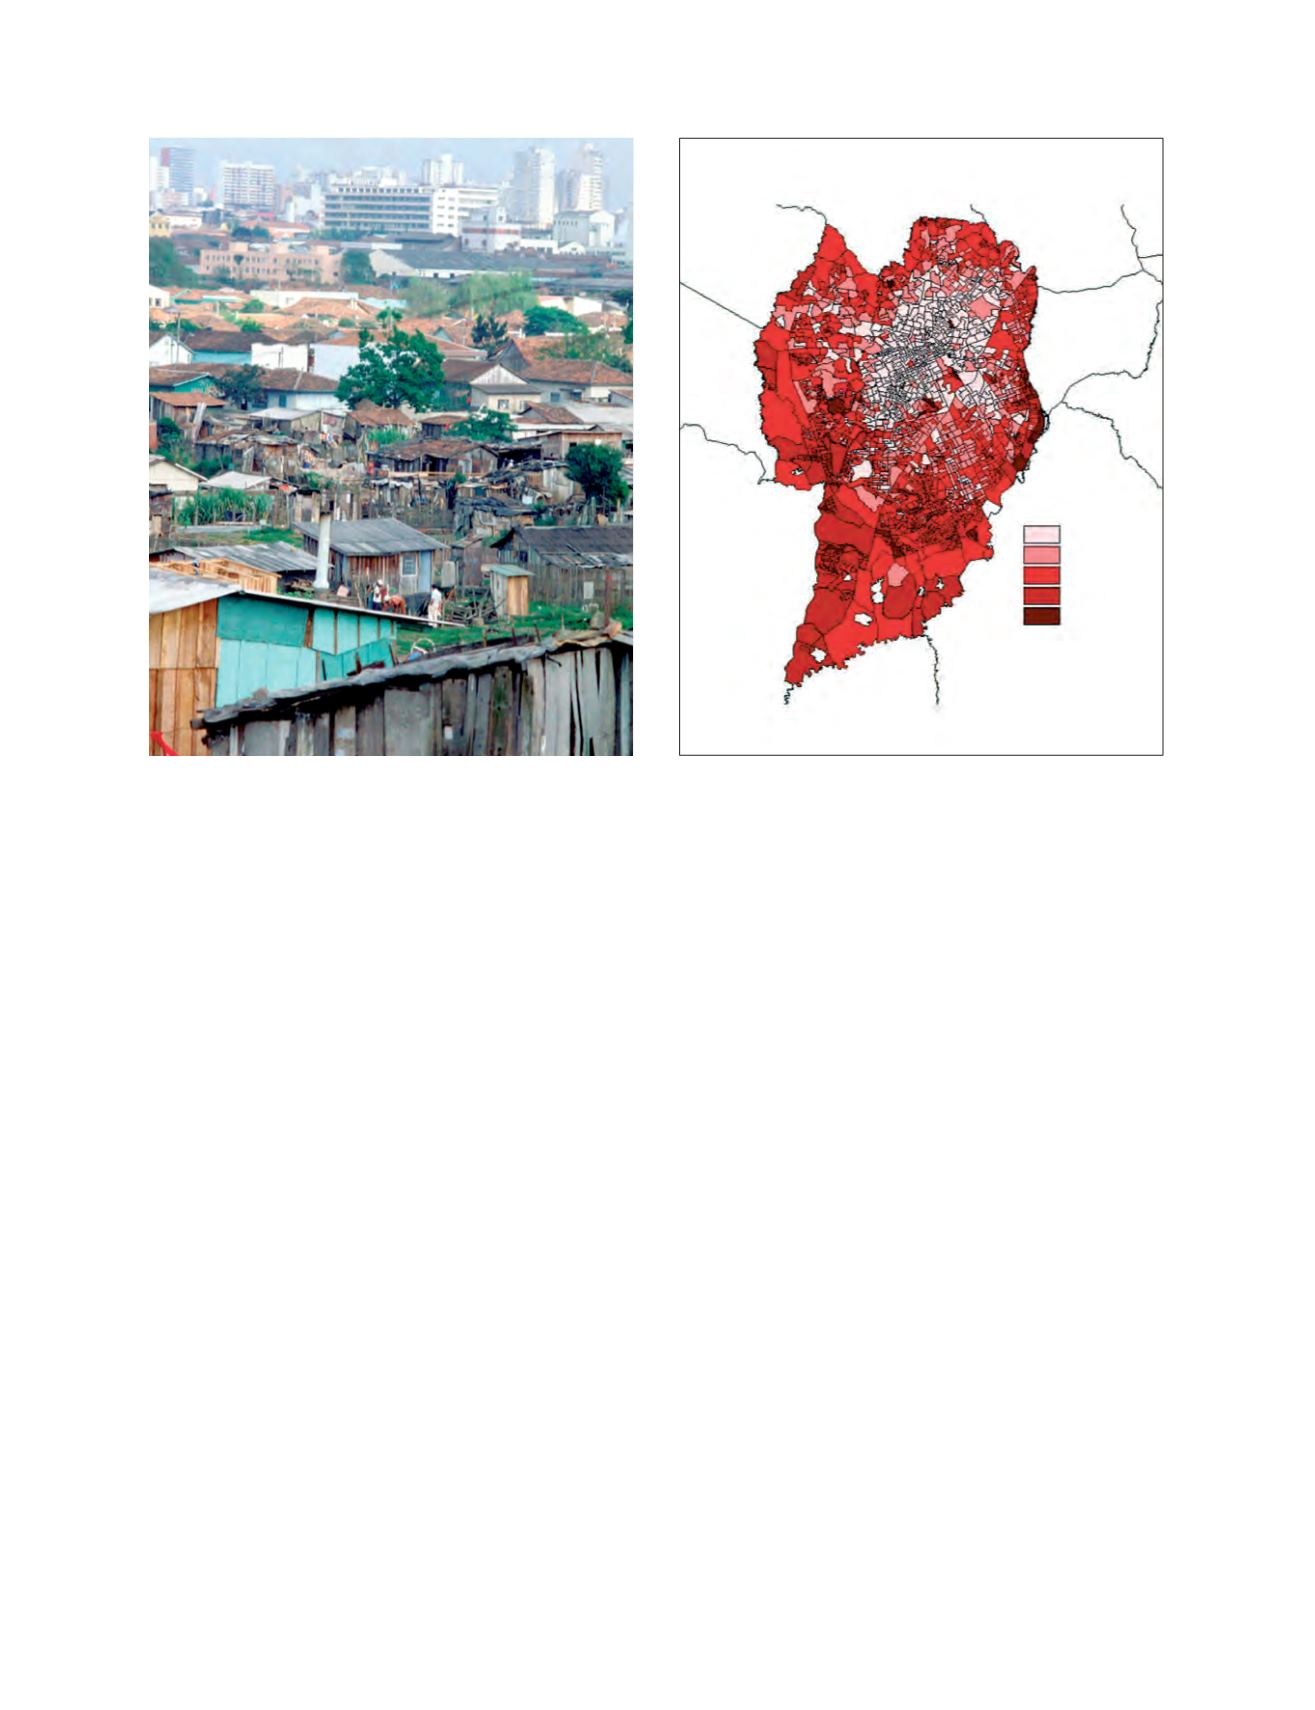
This map shows the average level of literacy per area for the city of
Curitiba (Brazil). The darker zones respresent a low level of literacy.
Image: copyright ORBIS
Low
High
Literacy