


 89 / 218

[
] 89
this was the longest recorded heat wave in July since 1941. It
is noticeable that during this heat wave a large number of warm
days and nights occurred, where the values of maximum and
minimum air temperature were above values that only occur
in 10 per cent of cases. There were also a great number of
consecutive days with very high minimum air temperatures.
Of particular relevance is the observation that the greatest
values of the number of consecutive days with minimum
temperature ≥ 20ºC (tropical nights) were exceeded in the
period 8-18 July.
From 2 to 13 August a heat wave occurred in coastal north-
ern and central regions, with a duration of 8-11 days; however
the greatest values of the number of consecutive days with
minimum temperature ≥ 20ºC occurred in central and south-
ern inner regions.
Weather stress index
The weather stress index (WSI) is related to human physio-
logical discomfort, and is based on the calculation of Net
Effective Temperature (NET). The parameters used in the NET
computation are temperature, relative humidity and wind, all
of which are derived from numerical weather prediction
models. The effective temperature (the NET predecessor),
initially proposed by Missenard in 1937,
25
included the rela-
tive humidity effects, but was limited to hot conditions.
Modifications by Gregorczuk
26
incorporated the wind effect
and generalized its use to include cold conditions.
The NET is consistent with common human perception:
• In hot weather, the NET increases with increasing temper-
ature and/or relative humidity, and decreases with
increasing wind
• In cold weather, the NET decreases with decreasing
temperature and with increasing relative humidity and/or
wind.
This is an important advantage over less complex indexes using
only the temperature, and over more complex indexes that
require parameters, such as radiation, which are difficult to
forecast.
The WSI is a percentile derived from the ‘NET climatology’.
For example, a day with a WSI=99 per cent means that only 1
per cent of the days in the analysed period had a NET greater
than the NET calculated for that day. Similarly, a day with a
WSI=1 per cent means that only 1 per cent of the days had a
smaller NET. Extreme values of WSI are correlated with
extreme physiological discomfort, and therefore the WSI can
be used as a risk index in bioclimatic studies.
The effect of global climate change, and specifically of global
warming on population health is an important issue for all
professional groups that work in the field of public health. The
task of predicting the consequences and reducing the effects
of continuing global warming upon the health of the popula-
tion must continue. With insight and application, many of the
health impacts of extreme weather events can, in fact, be
prevented.
NET = 37 -
37 - T
-0-29T (1-0.01RH)
0.68-0.0014RH +
1
1.76+1.4v
0.75
T is the dry thermometer temperature in degrees Celsius.
v is the wind speed in metres per second
RH is the relative humidity in per cent
Source: IM Portugal
Calculation of NET Effective Temperature (NET)
Source: IM Portugal
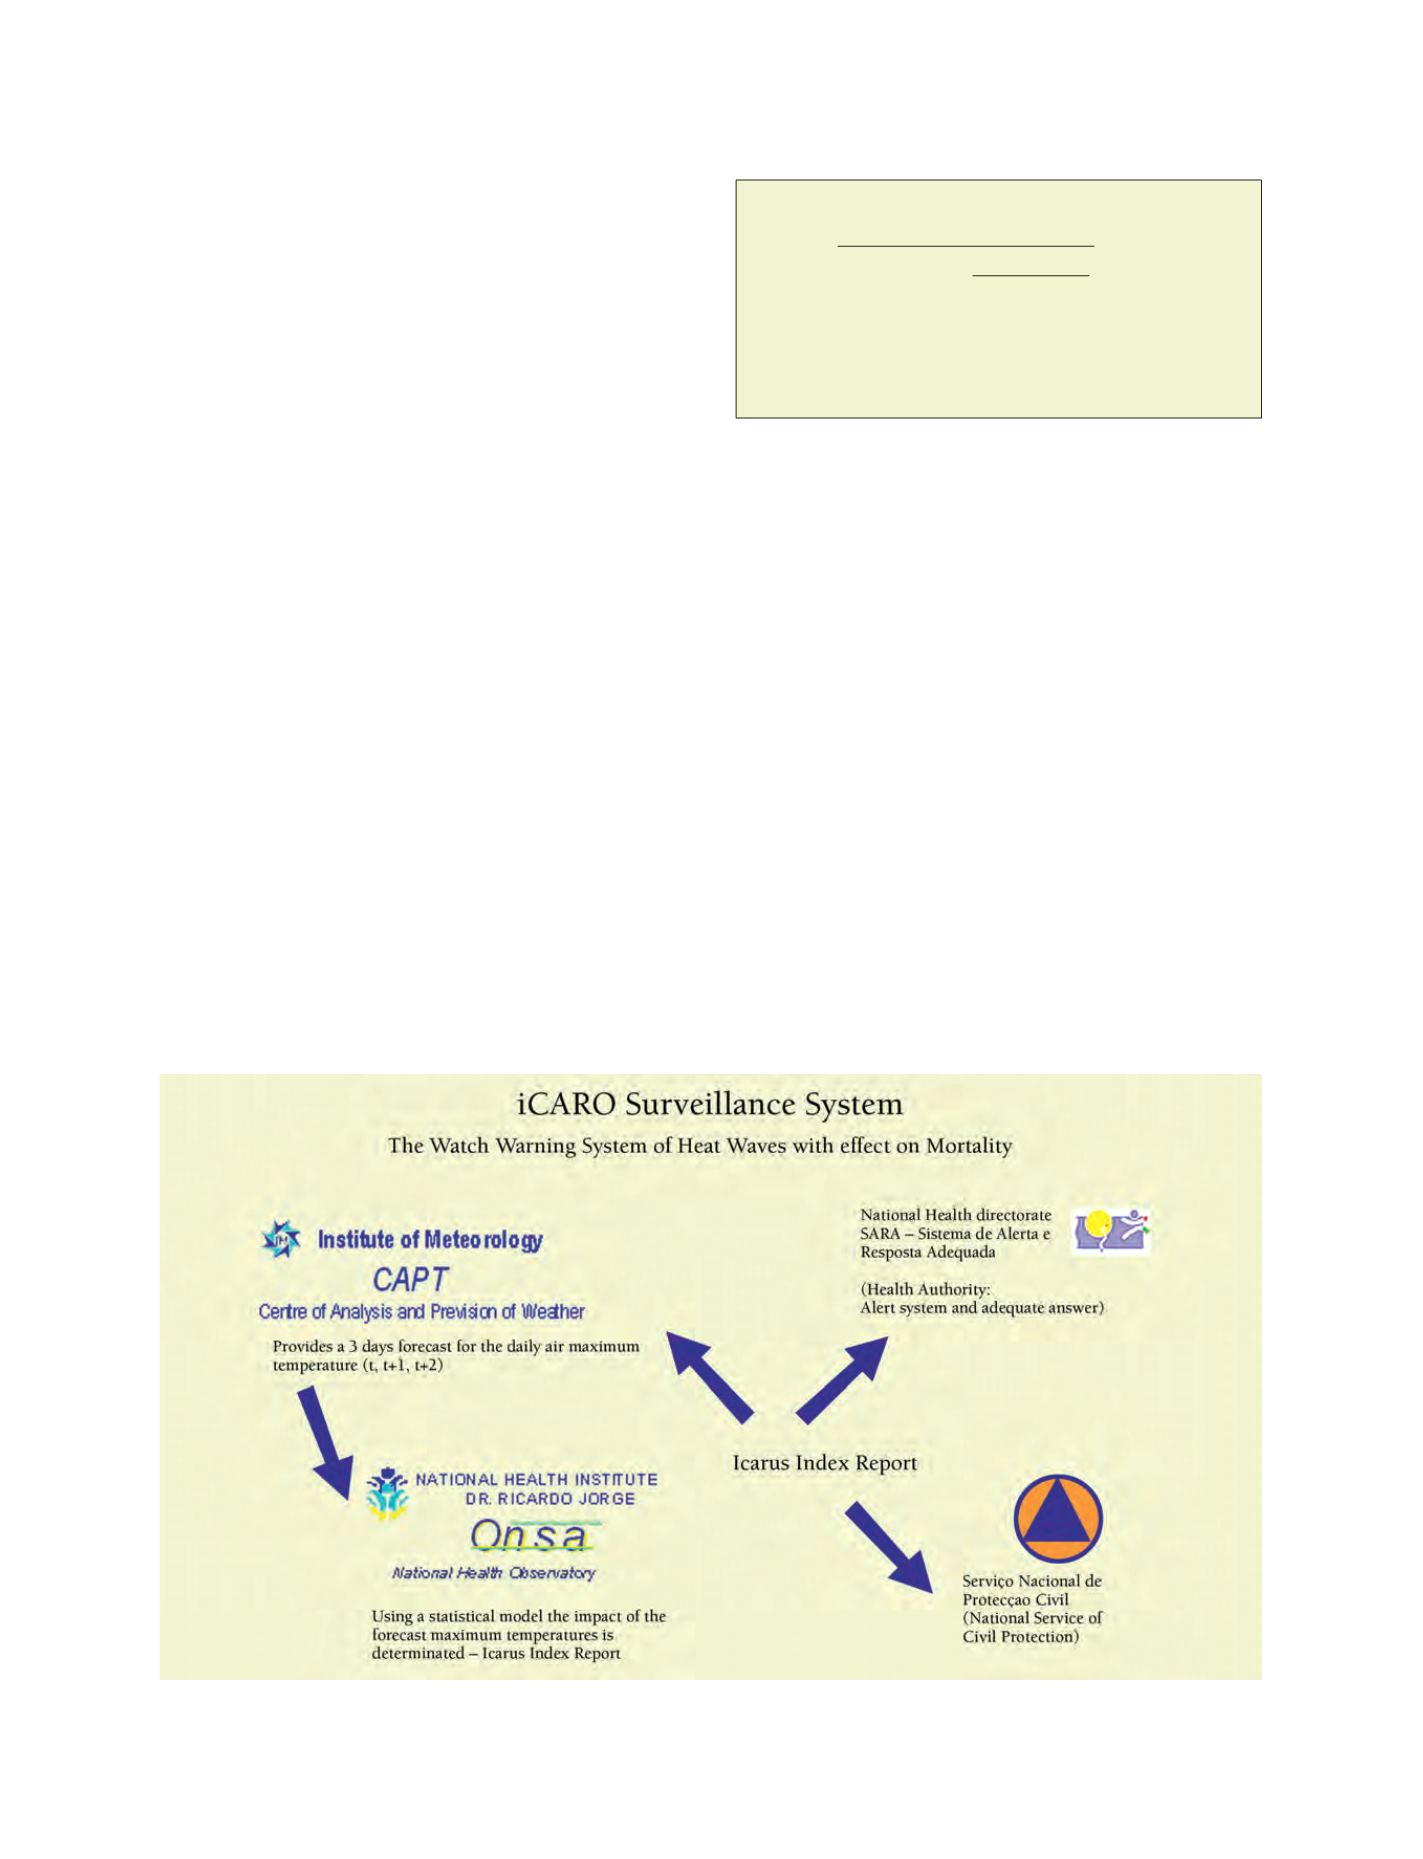
iCARO Surveillance System