


 92 / 218

[
] 92
warnings, hydrology (including flood control), air-quality
forecasting, chemical emergency response, transportation
safety, and energy management… The Helsinki Testbed
9
is a
Finnish initiative aimed at developing enhanced three-dimen-
sional mesoscale observation networks critical to the
advancement of modeling systems and related user applica-
tions. It is a public-private-academic partnership. The
program is open to all interested parties and the data is freely
accessible through the Internet. Related stakeholder groups
include homeland security, agriculture, insurance, urban
management, coastal zone management, media, and public
safety.”
A recent community workshop
10
with international partic-
ipation considered the requirements of effective mesoscale
measurement networks, and concluded that: “existing
mesoscale measurement networks do not provide observa-
tions of the type, frequency, and density that are required to
optimize mesoscale predictions and nowcasts. To be viable,
three-dimensional mesoscale observation networks must
serve multiple applications, and the public, private, and acad-
emic sectors must all actively participate in their design and
implementation as well as in the creation and delivery of
value-added products. The [urban] measurement challenge
can best be met by an integrated approach that considers all
elements of an end-to-end solution: identifying end users and
their needs; designing an optimal mix of observations; defin-
ing the balance between static and dynamic (targeted or
adaptive) sampling strategies; ensuring data standards and
data quality, establishing long-term testbeds (such as evalu-
ation and demonstration programs); and developing effective
implementation strategies.”
The challenge is to determine the most effective mix of obser-
vations, including alternative network configurations and
sampling strategies. For example, in improving mesoscale
analyses and predictions, it may be more cost effective to
sample only the boundary layer, with denser coverage, than to
similarly enhance observations in the upper troposphere. It
may be more cost effective to deploy intermittent, targeted
observations at high resolution than to maintain dense arrays
of continuous sensors. Regional testbeds are an intermediate
step needed to provide answers to these and other questions.
Testbeds must carefully gauge the value of forecast products
provided to end users.
Improved mesoscale observations present many chal-
lenges. For example, the top observational priority for
operational nowcasting is to establish a dense mesoscale
network of surface weather stations to measure winds and
state variables and provide real-time sub-hourly reports.
Minimum station spacing in urban areas should be 10 km
or less, and the reporting frequency should be every five
minutes or less. Radar is an invaluable tool for nowcasting
applications, yet the current operational systems have not
kept pace with technological advances. Dual-polarization
capability should be implemented on existing radars, and
private and academic radars should be integrated into oper-
ational networks. Consideration should also be given to
deploying X-band polarimetric radars, as well as techniques
for improving boundary layer coverage through the use of
closely spaced, low power X-band radars. Radar refractivity
measurements should be evaluated as a possible tool for
improving nowcasting by sensing moisture discontinuities.
Products detailing near-surface water vapour fields should
be provided in real time to forecasters and assimilated into
models to demonstrate their potential to improve nowcast-
ing. There is also a pressing need to provide boundary layer
observations using radio frequency (RF) wind profilers. Not
only are additional observation systems required – includ-
ing in situ and remote sensors, both earth- and satellite-based
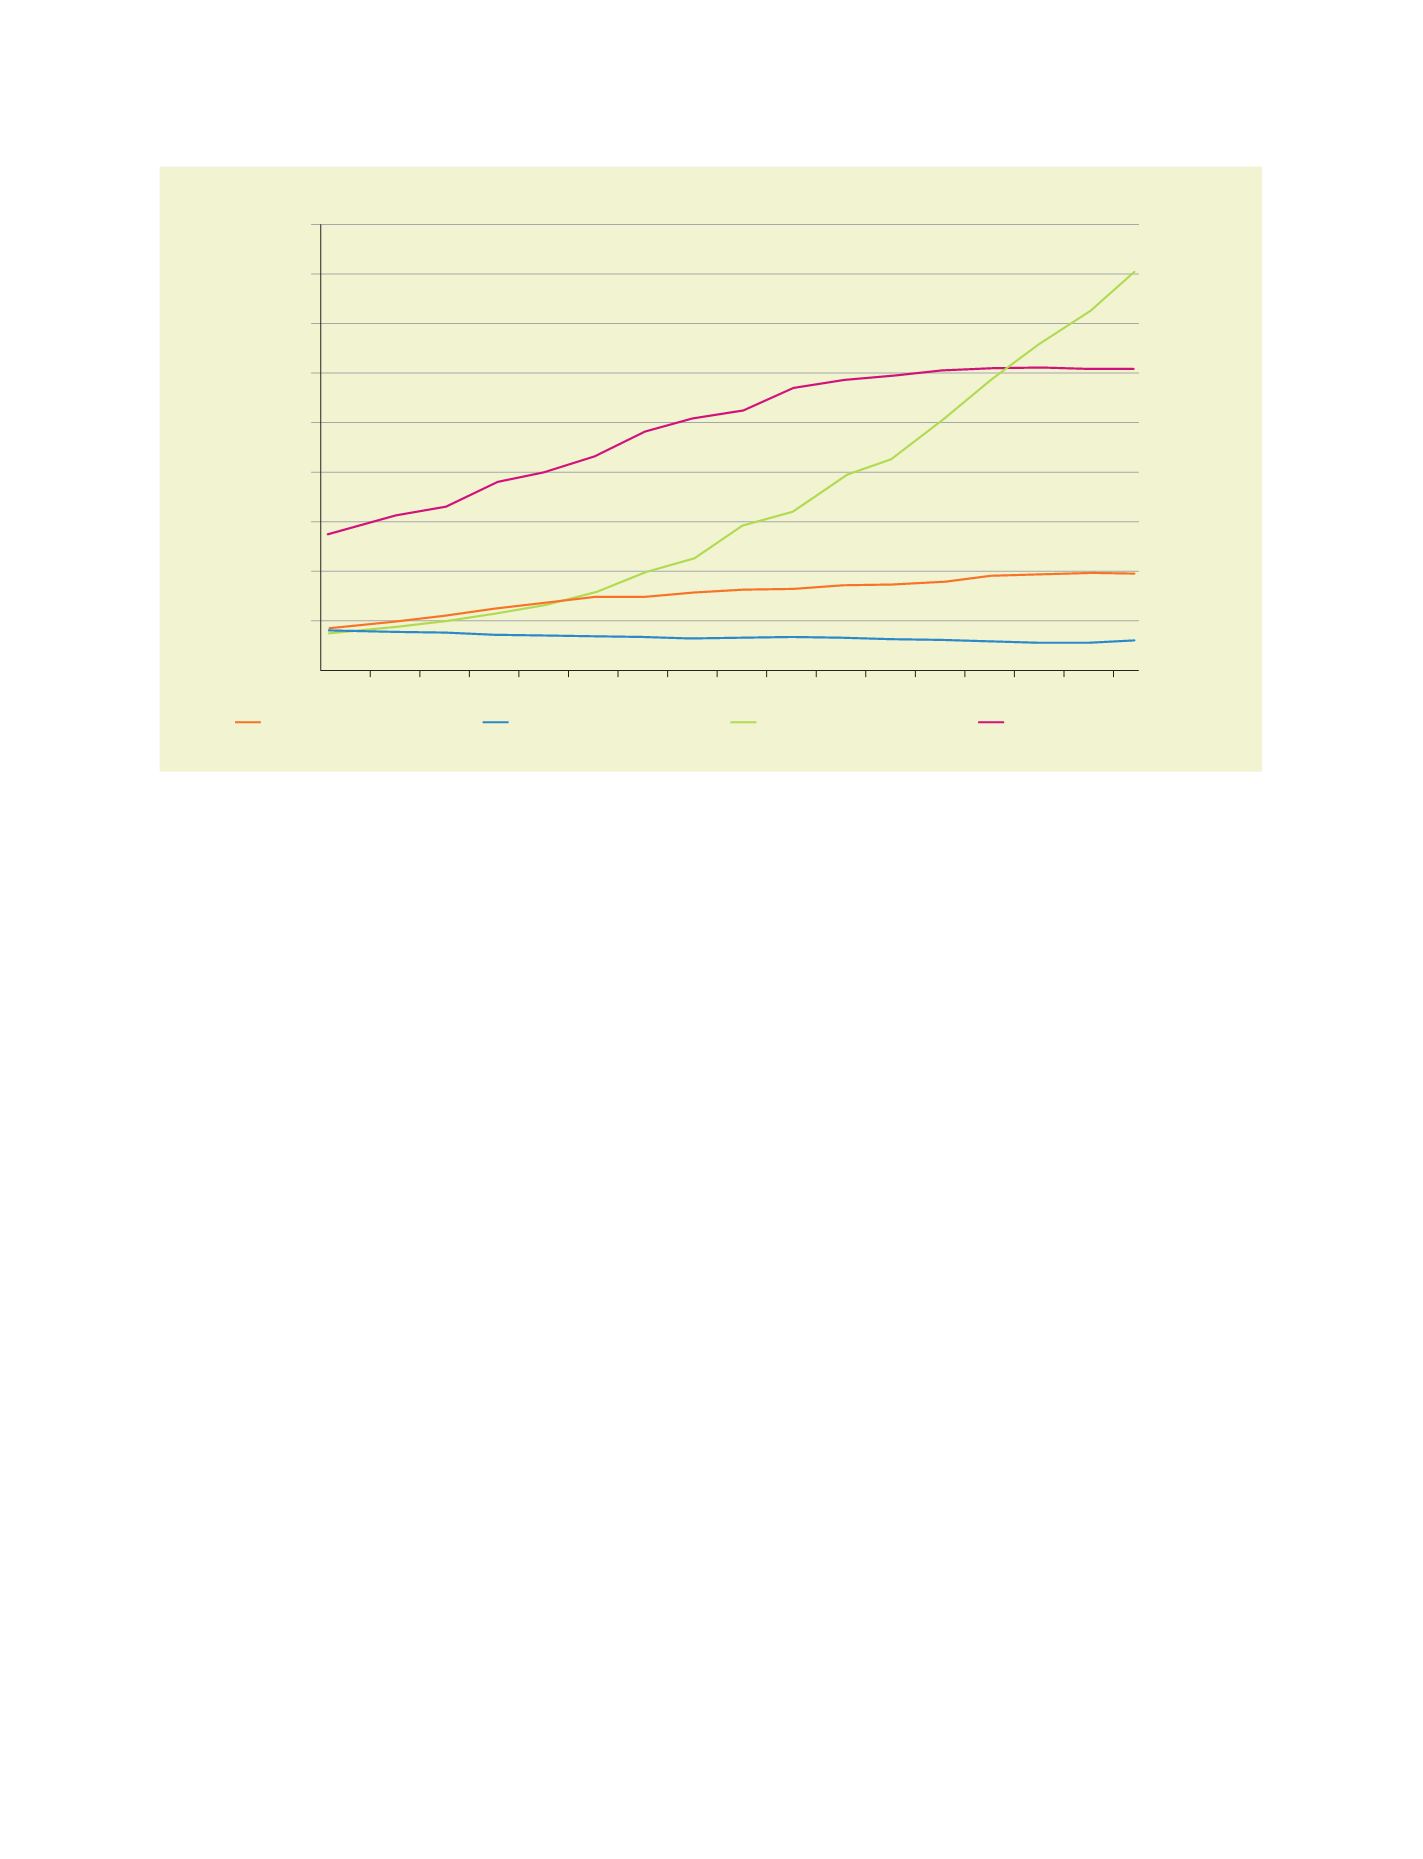
500
1000
1500
2000
2500
3000
3500
4000
4500
0
1950
Population (millions)
Urban-more developed regions
Rural-more developed regions
Urban-less developed regions
Rural-less developed regions
1955 1960 1965 1970 1975 1980 1985 1990 2000 2005 2010 2015 2020 2025 2030
Urban and rural population of the more and less developed regions, 1950-2030
Source: UNPD, 2001