


 70 / 280

of July 2007 and downloaded directly from the US Global Data Centre
via the Internet, in time for their inclusion in this article, which was
written during August 2007. The data were plotted using Ocean Data
View, which is publicly available software. This capability places the
power to map present ocean conditions right where it belongs, at the
fingertips of local scientists, government agencies, interested students
or public users anywhere in the world.
This is a blue planet whose surface area is dominated by oceans.
Between the equator and 60°S, 84 per cent of the globe is ocean,
including the most remote and inaccessible regions of the world.
The Argo programme committed at an early stage to sample the
northern and southern hemispheres equally, and progress contin-
ues toward that objective. Already, Argo’s dataset in the critical but
remote region of the Southern Ocean greatly exceeds, in number
and coverage, the total of all previous Southern Ocean observations.
The future of Argo
The future of Argo depends on demonstrating the value of system-
atically repeated observation of the global oceans. Already, at least
14 operational centres in the US, Europe, Asia and Australia are
ingesting Argo data into ocean data assimilation and forecast
models to improve estimates of the state of the ocean and to initial-
ize seasonal and interannual predictions. Scientists from all over
the world have used Argo data in more than 100 research publica-
tions in the past few years. Nevertheless, since a primary objective
of Argo is the ocean’s role in climate, its value can be realized only
when the array has been sustained over climate-relevant timescales.
While Argo already observes seasonal variability on global scales,
it will take a decade to show its power in observing interannual
variability.
Fortunately, many of Argo’s capabilities are simple and
straightforward – for example, a monthly time-series
can be produced, showing the ocean’s temperature, aver-
aged from the sea surface to 2,000 metres, globally as
well as separately in the northern and southern hemi-
sphere. This is the seasonal ‘heartbeat’ of the oceans,
showing that the annual and the interannual variability
in temperature are greater in the northern hemisphere,
but that the southern hemisphere, by virtue of its larger
ocean area, controls the April maximum in global mean
temperature.
While the ocean’s annual mean temperature has
been fairly constant over the past three years, this was
not the case over the past 50 years, with ocean
warming accounting for more than 80 per cent of the
total heat absorbed by the climate system (air, sea, land
and ice). When the global mean ocean temperature
from Argo is compared to earlier estimates made from
much sparser datasets by S. Levitus and colleagues,
the surface layer of the oceans is thought to have
warmed by about 0.4°C over the 50-year period, with
the 0-2,000 metre average warming by about .07°C.
Unfortunately, the sparseness of pre-Argo data, partic-
ularly in the Southern Ocean, means that the pace of
change is highly uncertain; the actual warming could
have been twice the estimated rate. This is critical
information for the testing and verification of climate
models. For the future, Argo eliminates the uncer-
tainty that has been experienced due to
under-sampling.
[
] 70
Southern Hemisphere
Global
Northern Hemisphere
2004
2005
2006
2007
-0.08
-0.04
-0.00
0.04
0.08
0-2000m temperature anomaly (degree C) from the annual mean
Time-series of 0-2,000 metre temperature, degrees Celsius
anomaly from the annual mean, for the northern (blue) and
southern (red) hemisphere oceans and the global ocean
(black), from Argo data. Each line is plotted as the anomaly
from a three-year, 2004-2006 mean value
Argo floats observe the pulse of the oceans
Source: Dean Roemmich
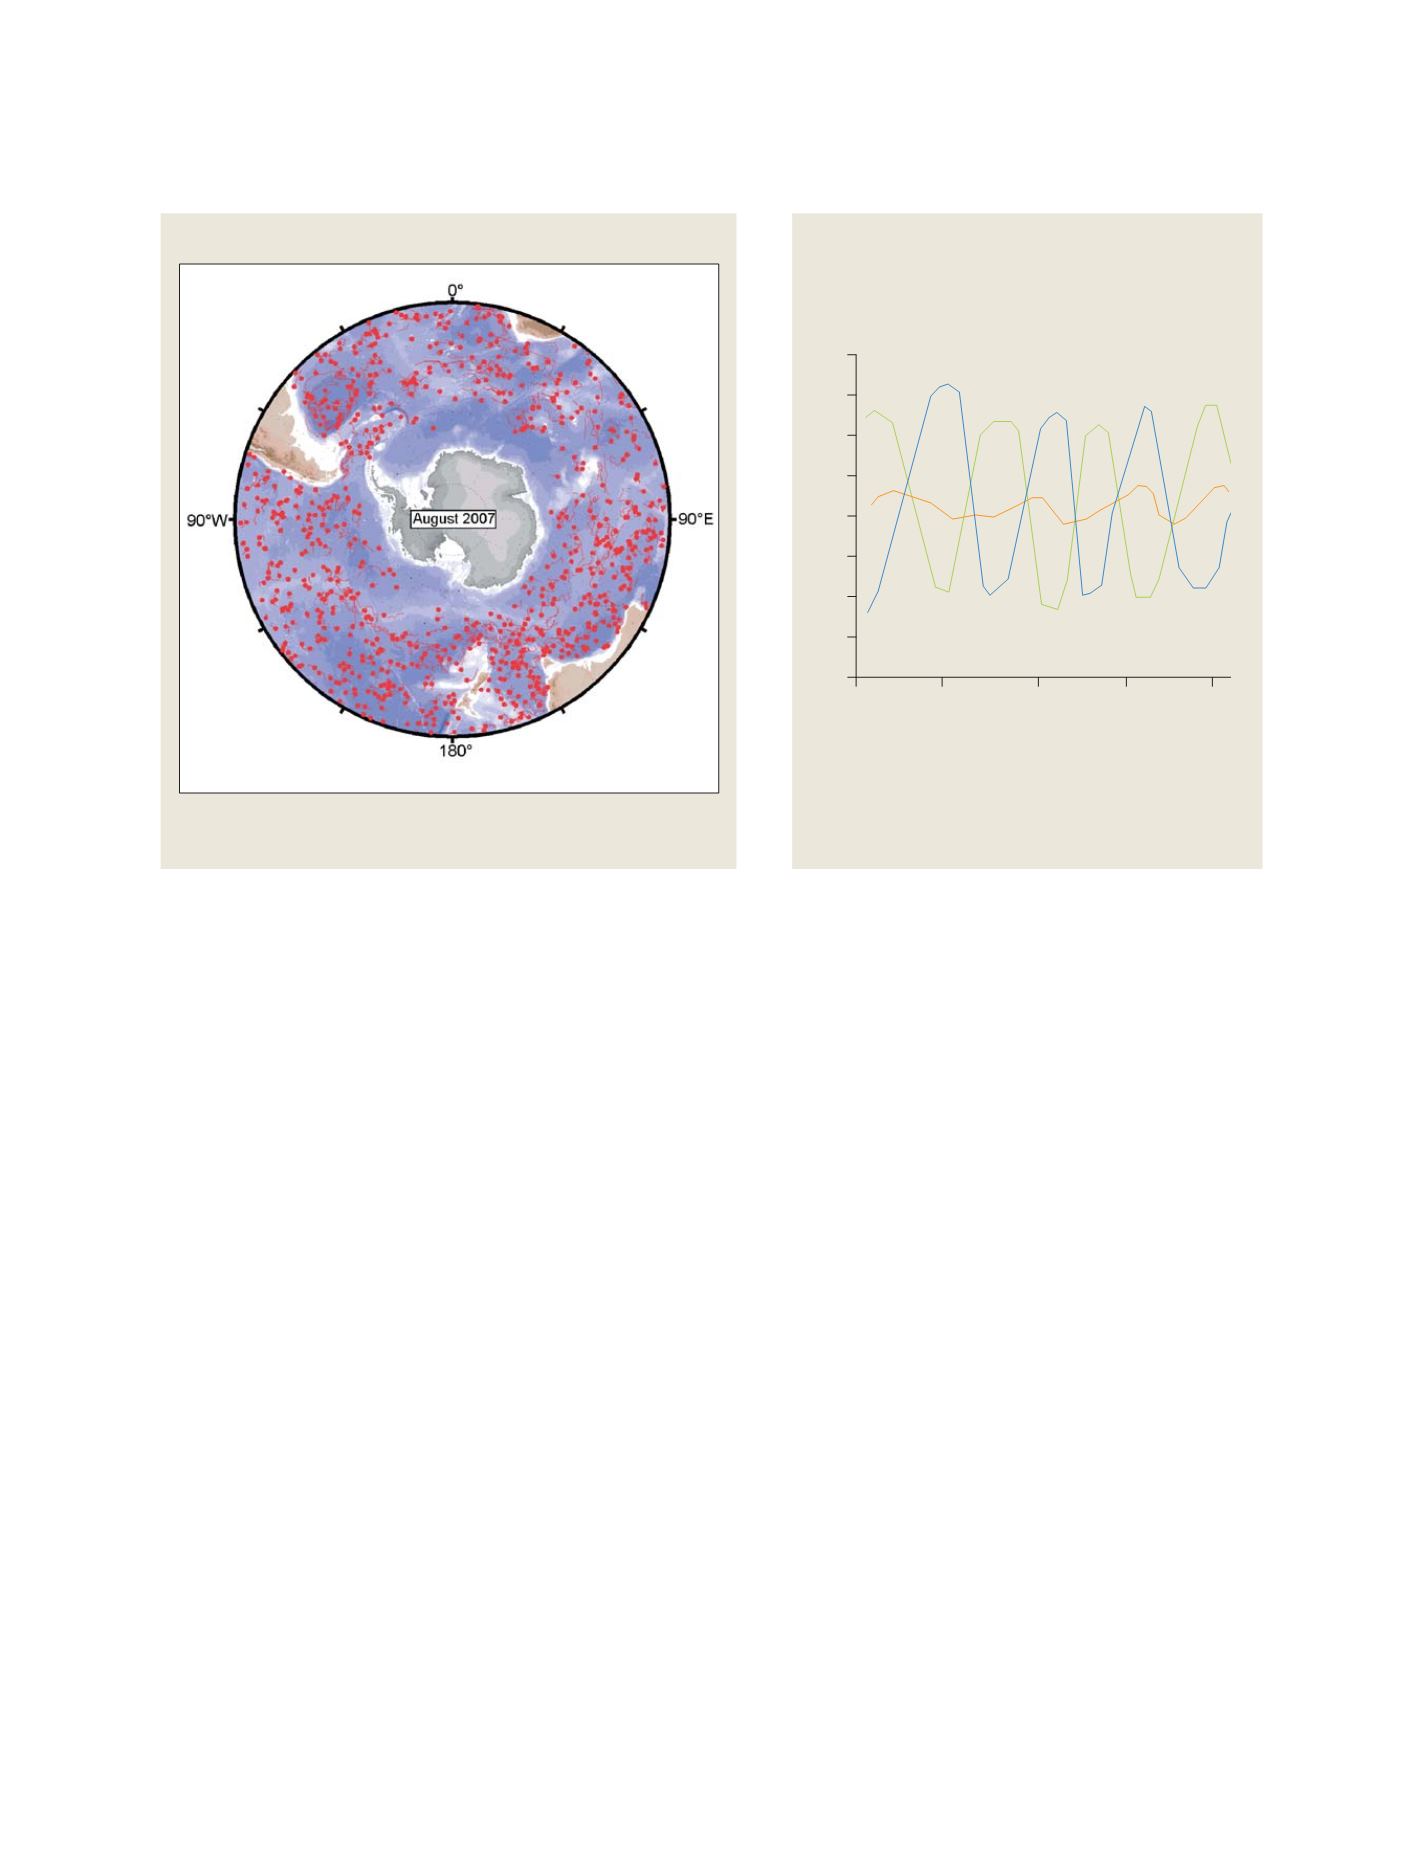
Distribution of floats in the Southern Ocean, August 2007
Some of the blank areas close to Antarctica contain floats, but at the time of this
image these are under winter ice cover. They and will reappear in austral spring
Source: Howard Freeland
GEOSS C
OMPONENTS
– O
BSERVING
S
YSTEMS