


 246 / 288

[
] 247
C
apacity
D
evelopment
gation in municipalities, find the most suitable set
of actions and find case studies and best practices.
Municipalities themselves can also add their own solu-
tions to the site.
As an additional component, a Facebook page of
the portal is being used as an interactive communica-
tion tool.
1
Use of the information is free of charge and
is permitted for non-commercial purposes, provided
that the source is mentioned whenever information
is used.
A comprehensive service
Information regarding socioeconomic factors is included
in the service. The sources are various research projects
and scientific articles, many of which originate from the
Finadapt research project (2004-2006).
The socioeconomic information can be accessed
through various articles on the portal. It is also
included in the checklist tables of the sectoral arti-
cles of the Community Response Wizard component
of the portal, covering aspects such as climate change
mitigation in social services through energy saving and
energy efficiency.
Mitigation and adaptation case studies/solutions
are presented to illustrate socioeconomic factors; for
example, there is a description of how the City of
Tampere assessed the costs of implementing planned
emission reduction measures.
User-specific information
The information in the Climate Change Explained
component of the portal is generic and aimed at all citi-
change: the phenomena leading to climate change, the impacts of
climate change, opportunities for mitigation of climate change and
challenges in adaptation to climate change.
Climatguide.fifeatures approximately 250 web articles on climate
change issues, checklists, adaptation and mitigation solutions, learn-
ing modules, observational and modelled data and interfaces for
data visualization.
The three main components of
Climateguide.fiare:
• Climate Change Explained
• Maps, Graphs and Data
• Community Response Wizard.
Climate Change Explained provides research-based information on
physical climate science focusing especially on climatic changes in
Finland as well as impacts, mitigation and adaptation measures in
Finland. This section consists of mainly web articles produced in a
standard format providing references, internal and external links to
further information. In addition, eight learning modules and visu-
alizations on selected subject have been produced for the benefit of
the users (above).
Maps, graphs and the data component conveniently provide users
with insight into observed and anticipated climate change and its
impacts through maps and graphs. With the help of the easy-to-use
interface, citizens and decision makers can learn from the past and
look to the future.
Community Response Wizard offers support and options for
both adaptation and mitigation for local scale planning and deci-
sion-making in municipalities. It helps the user to quickly grasp
the main impacts of climate change in each sector of the munici-
pal sphere of authority (Land Use and Construction, Technical
Services, Education and Culture, Social and Health, Environmental
Protection), understand the possibilities for adaptation and miti-
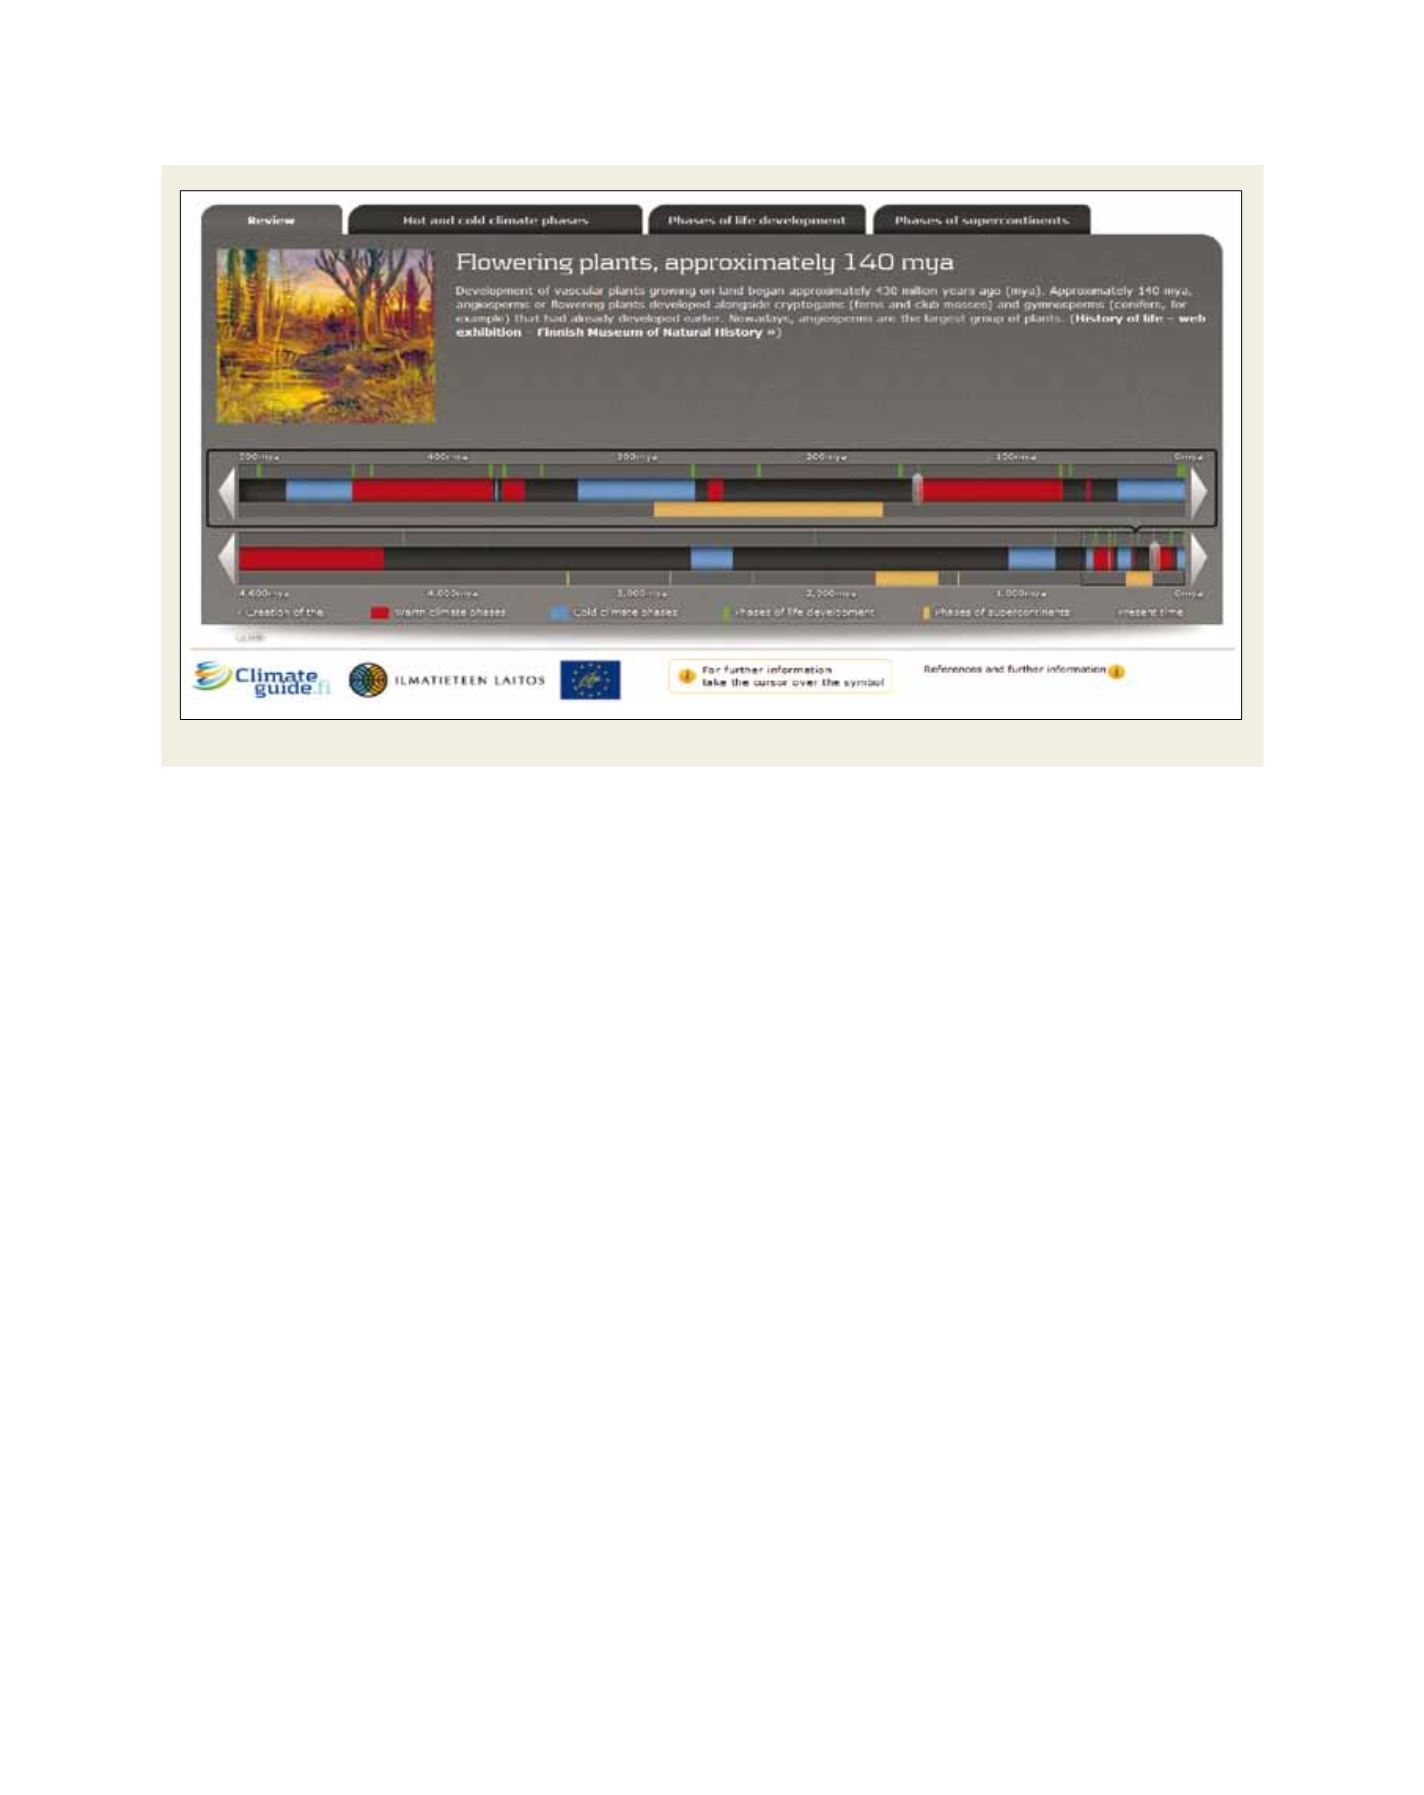
One of eight learning modules available at
Climateguide.fiportal in 2012 is a climate history of the world
Source: Finnish Meteorological Institute