


 247 / 288

[
] 248
C
apacity
D
evelopment
Source: Finnish Meteorological Institute
zens and decision makers. Impacts, mitigation and adaptation are
also dealt with from the sector-specific point of view.
The Community Response Wizard is the first tailored section of
the
Climateguide.fiportal. The next tailored section will be available
to senior secondary education level users.
With the Observed and Projected Climate map and graph tool,
climate observations and projections can be visualized and in the
future will also be available for download on the basis of geographic
location. The Climate Impacts map tool shows modelled impacts for
various sectors.
Tailored information is provided by the expert organizations
responsible for the portal. Users are encouraged to suggest adap-
tation and mitigation case studies and in these cases, information
is provided by a joint team of the user, the science editor of the
portal and an expert.
When users need more tailored information than the
Climateguide.fiportal can provide, they are guided further to
make contact with expert services from the content producers of
the portal. In case the information cannot be found within these
services, the users are helped to locate a service producer that can
assist in the specific problem.
The stakeholders of
Climateguide.fiare:
• Users (citizens, decision makers, actors at municipal level)
• Climate change information providers (research institutions,
universities, ministries, public authorities)
• Policy makers and funding organizations.
How stakeholders were identified and involved
The stakeholders were identified by FMI, SYKE and
Aalto University early on in the service development.
The need for a national service that focuses on serving
decision makers and planners at local level was iden-
tified. Stakeholders were involved throughout the
development process, serving in workshops and as
members of the steering group of the project. Surveys
on user requirements were conducted, and concepts of
the portal were tested with a stakeholder pilot group.
In operational terms, the first level is the content of
the web service and the various tools within it. At the
second level, a user contacts
Climateguide.fiperson-
nel for further questions, comments, suggestions
for improvements or requests for data. The person-
nel either answer the needs of the user themselves
or facilitate the connection between the user and the
service provider that can deliver the service in ques-
tion. User feedback is utilized to improve the service
of
Climateguide.fi.In the case of local solutions in the municipalities,
the information flow can go in different directions. A
user can describe a mitigation or adaptation solution
at his/her municipality and send it to
Climateguide.fivia a solution form.
2
After the information is received,
the editor reviews it and contacts the sender of the
solution for further clarification and additional informa-
tion. Following any necessary revisions, the solution is
published as a part of the sectoral article in Community
Response Wizard.
The service entered its launch (Beta) phase at the end
of 2011.
Funding mechanisms
The
Climateguide.fiwebsite was produced in cooperation
by FMI, SYKE and Aalto University. The undertaking was
part of a three-year EU Life+ project (2009-2011). The
content providers will maintain and develop the website
but new providers are also welcome to join the portal.
Operations in 2012 have been supported by the Ministry
of the Environment, the Ministry of Transport and
Communications, and the Finnish Innovation Fund, Sitra.
There are great possibilities to upscale the project in
terms of special user groups addressed, such as munic-
ipal actors and senior secondary education groups.
Several sectors, such as forest owners, farmers and the
tourism industry, would benefit from a tailored version
of
Climateguide.fi.
Scaling up of the service in terms of broadening the
pool of information and content providers of the site
is another very plausible path of development. The
research institutions for forestry, game and agriculture
in Finland have been identified as the next partners
for service production under the umbrella of the
Climateguide.finetwork.
Management of the project
In order to consolidate the portal and develop the serv-
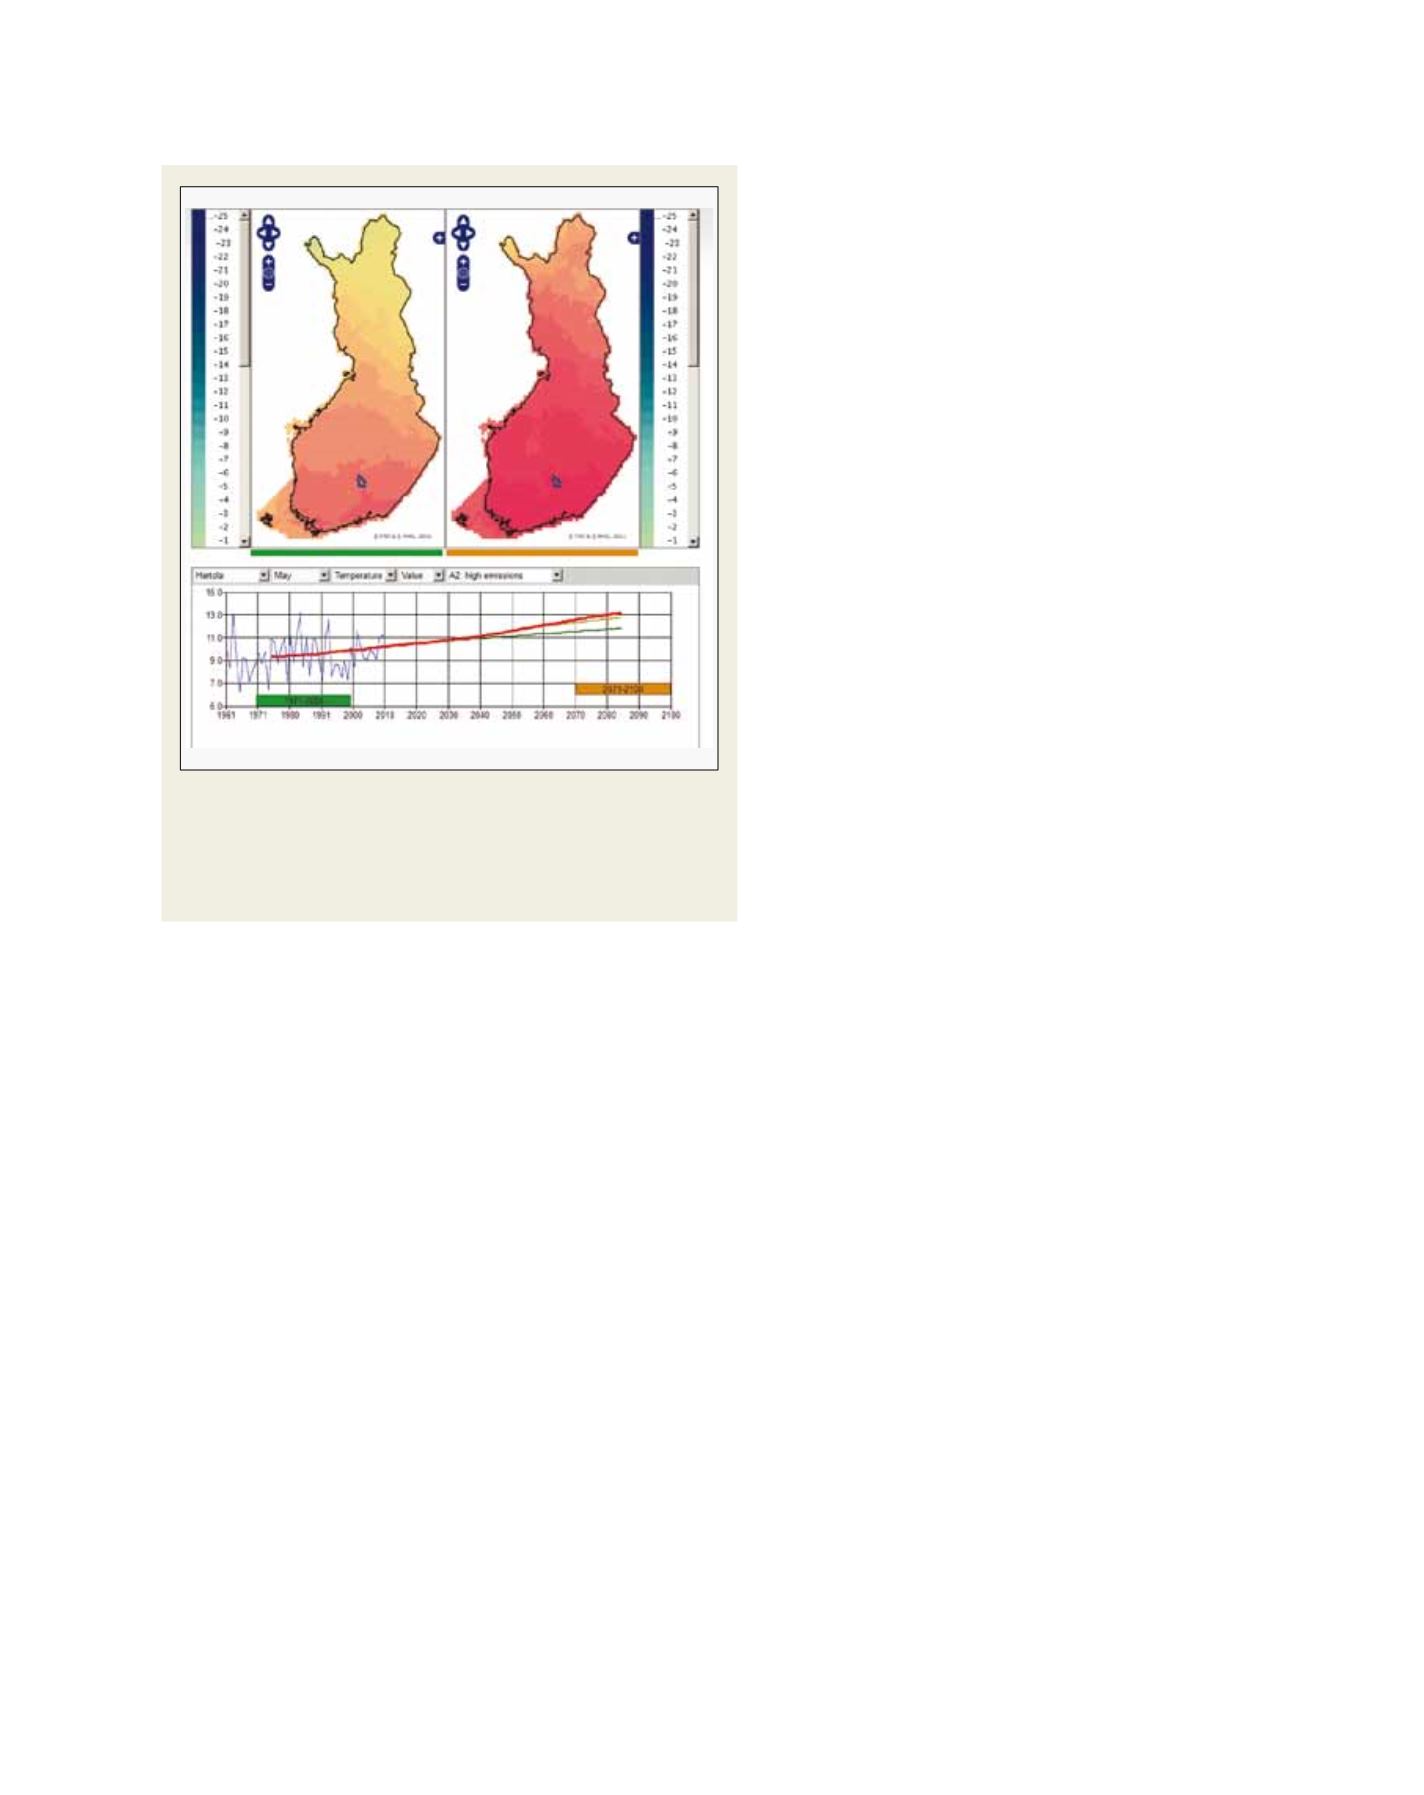
ices, a Steering Group has been formed. It consists
The map on the left shows the average monthly values in the present climate
of Finland (normal period of 1971–2000) and the map on the right the
corresponding projected future values. The graph below the maps shows
observed (blue curve) and simulated (red, yellow, green) values for selected
municipality for three scenarios.