


 238 / 287

[
] 239
A
dAptAtion
And
M
itigAtion
S
trAtegieS
and societal systems, policy makers will need different
methodologies and frameworks. Examples of these kinds of
impact include changes in river runoff that may necessitate
changes in the management of energy and water resources.
Capacity building to meet these challenges is ongoing.
Institutional realignment, starting with the merger of the
IcelandicMeteorological Office (IMO) and the Hydrological
Service will enable better support for policymakers. Climate
information services must be strengthened to ensure that
stakeholders have access to relevant information in a timely
manner. It is also important to participate at the regional
and international level. IMO has been active in several
International Polar Year projects, leading one on hydrol-
ogy, called Arctic-Hydra. Furthermore, IMO has headed
a series of Nordic-Baltic climate impact projects focusing
on three main renewable energy resources; hydropower,
biofuels and wind power, and how future climate change
within the next 20–30 years can impact these resources. All
the National Hydro-Meteorological Services in the region
are partners in this cooperation, which in many respects
constitutes a regional Climate Services Application Program
for the Nordic-Baltic region, including Greenland. A future
ambition is to develop the network into a formal Regional
Climate Service Application Program.
Theproject also intends tocontribute to theNordicCouncil
ofMinisters Top-level Research Initiative Programmes 2009–
2013, which will focus on impact studies, adaptation to
climate change and the interactionof climate changewith the
cryosphere, among other themes. Recognizing and respond-
ing to the risks and opportunities posed by climate change is
a challenging task for both scientist and policy makers alike.
As a consequence, glacial river runoff will increase during the first half
of the 21st century and peak before its end. Hydropower potential can
therefore be expected to increase in the first half of the century. Based on
past experience, changes in glacial riverbeds are likely, which can impact
both energy production and road services. Furthermore, it is likely that
production of magmawill increase under the thinningVatnajökull ice cap,
whichmay result inmore frequent or larger volcanic eruptions in the area.
Concomitant with the projected warming, further changes in biota
are likely. The enhancement of plant productivity and upward displace-
ment of tree limits is likely to continue. The impact onmarine life is more
uncertain, not the least due to insufficient knowledge of the long-term
consequences of recently discovered acidification of the oceans.
Impacts of projected climate change are likely to touch all sectors of
Icelandic society. Projected increases in hydropower potential, along with
enhanced plant productivity will affect the resource base of the country,
while increased risk of flooding both from rivers and rising sea levels will
influence planning and civil response. Because it is likely that there will
also be impacts that are not presently anticipated, decision makers must
be equipped to deal with uncertainties in impact projections.
The Fourth Assessment of the Intergovernmental Panel on Climate
Change discusses the need for adopting risk management practices in
dealing with projected impacts. In Iceland, there is a need to better quan-
tify the magnitude of impacts and assess the probability of significantly
adverse outcomes. To this end, further monitoring, systematic attribution
and enhancedmodelling, both of regional climate change and also of likely
impacts, will be required.
Iceland already has substantial experience in dealing with riskmanage-
ment of natural hazards, and existing frameworks can be adopted to deal
with some climate risks, such as possible increases in extreme weather,
flooding and volcanic eruptions. To deal with impacts that are not related
to singular events but rather affect the background conditions of natural
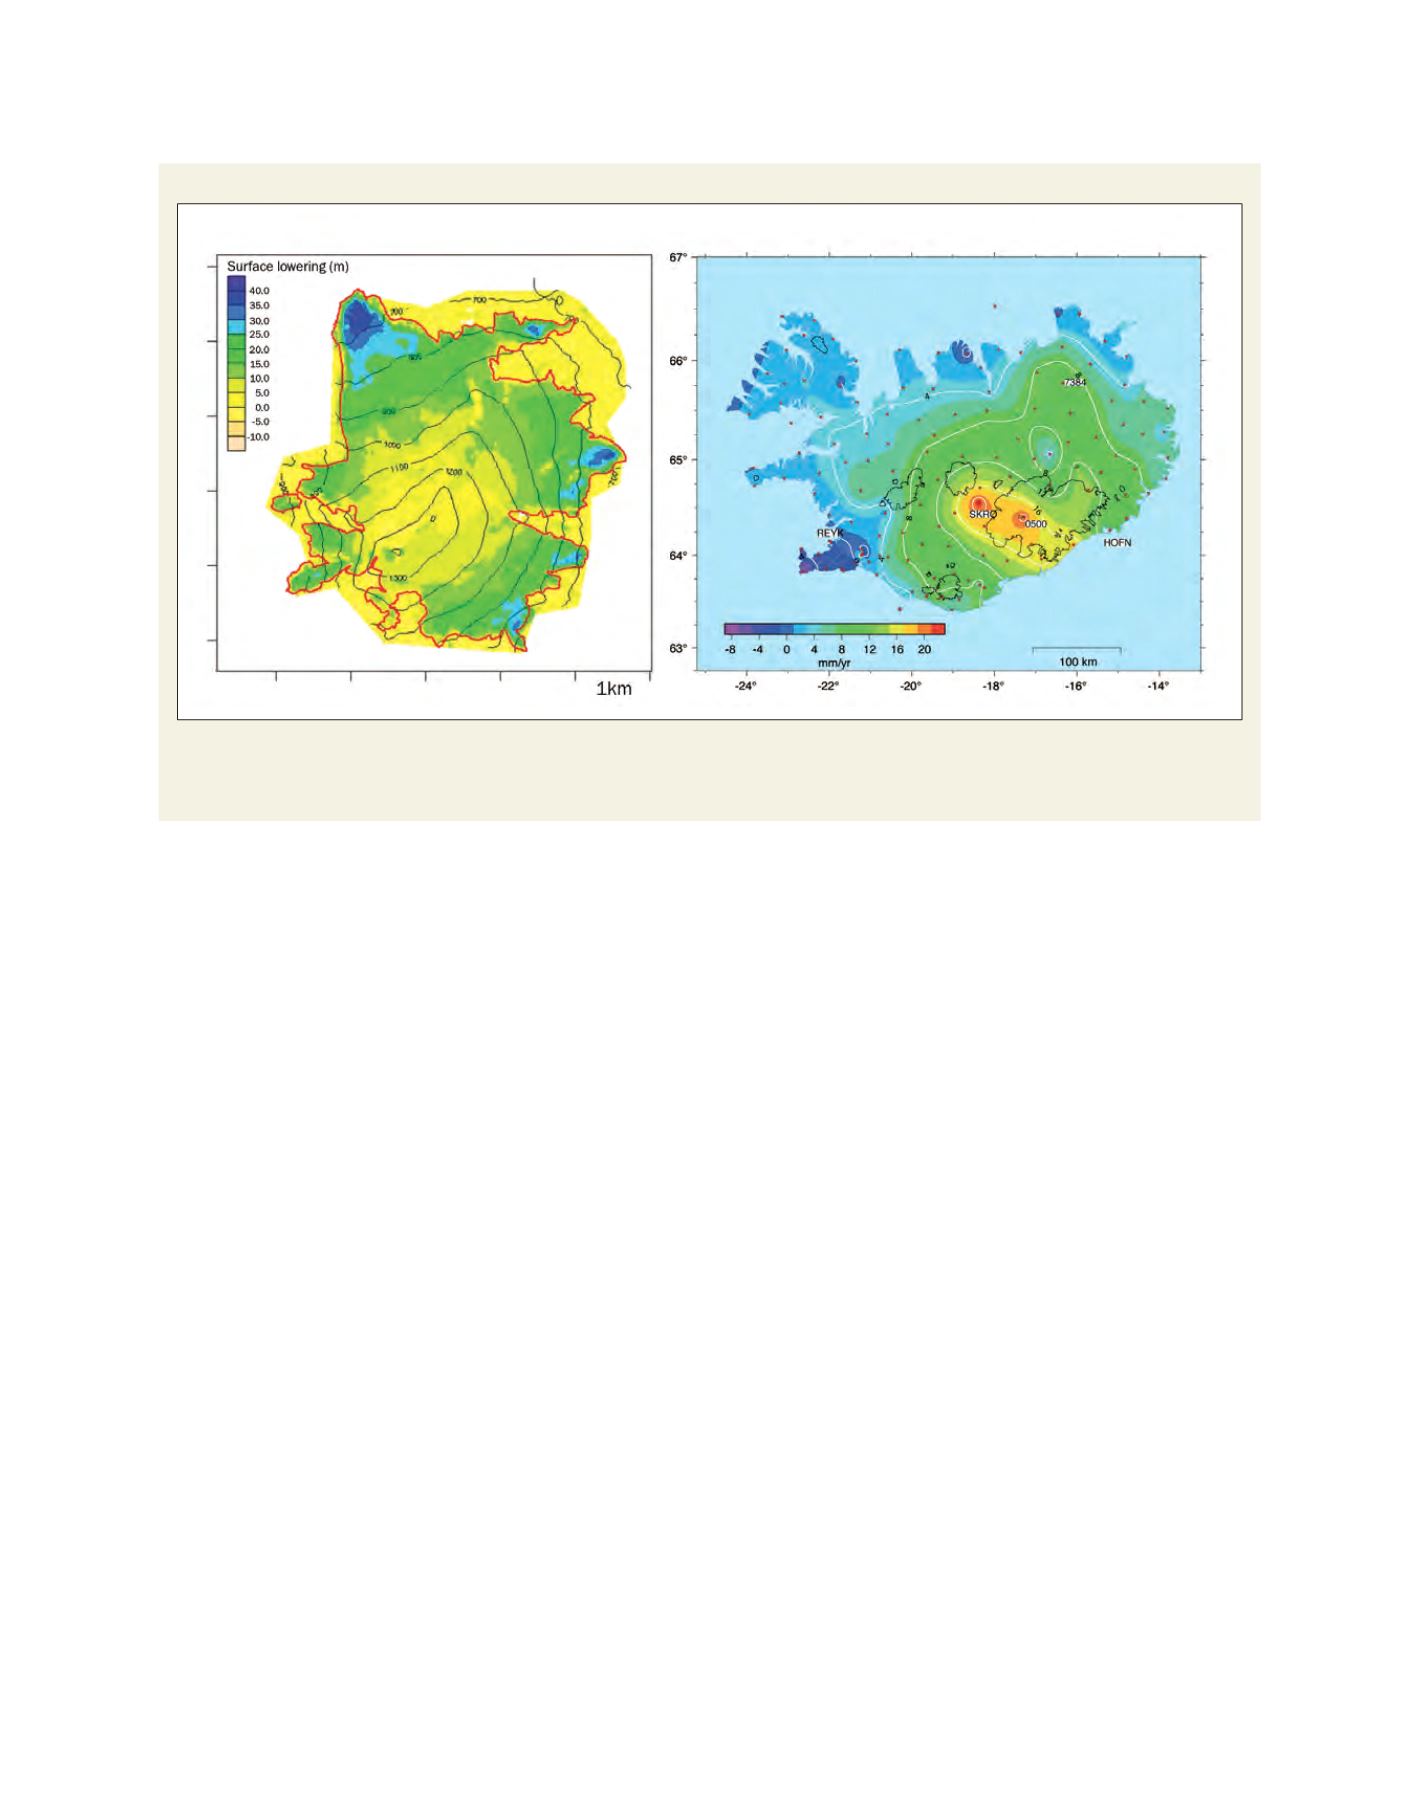
Thinning of Snæfellsjökull and glacial rebound in Iceland
Left: the changes in surface topography of the Snæfellsjökull glacier 1999-2008. The figure shows a widespread loss of ice, on average about 1.5 metres
per year. The red line indicates the outline of the glacier in 2000
1
Right: vertical motion of the land surface in Iceland based on measurements 1993-2004.
Positive numbers (green to red colours) indicate uplift, negative numbers (blue to violet colours) indicate subsidence
2
. Dots show the station network