


 162 / 196

[
] 160
The resultant geo-rectified imagery was transmitted from the
aircraft through a satellite communications system, down to the
ground control station and distributed to the community via the
Web. The data was formatted for visualization in a standardized GIS
environment and other data visualization applications. The full-on-
board data processing, from raw image collection through delivery
of geo-coded products to the ground, takes less than five minutes.
The project team then made the data ‘viewable’ in the GoogleEarth-
based CDE. This timely data distribution was critical to saving
valuable resources and effectively combating the various wildfires.
Collaborative Decision Environment (CDE) tool
An easy-to-use commercial-off-the-shelf (COTS) fire data integra-
tion and visualization solution tool was implemented. The Wildfire
CDE was originally developed to support data and sensor sharing
for NASA’s Mars Exploration Rover programme, and was modified
to allow use as a data and information sharing tool for wildfire disas-
ter managers. This technology spin-off allows the integration of
numerous web-enabled data sources to be collaboratively viewed
and implemented to aid in determining appropriate fire management
strategies.
To simplify the fire data visualization capabilities, NASA teamed
with Google to utilize and expand the capabilities of the GoogleEarth
freeware, allowing the integration of multiple, pertinent fire-related
data elements into a single package. These web-distributed elements
included real-time satellite weather information, predicted and actual
cloud cover data, predicted winds, satellite-derived fire hotspot detec-
tions, Remote Automated Weather Station (RAWS) data, the US
Weather Service Critical Fire Weather information, Ikhana aircraft
tracking positional information, sensor information and real-time
imagery feeds, the Federal Aviation Administration (FAA) flight
restriction area data, the National Interagency Fire Center’s Large
Fire Location data, the wildfire management team’s infrared mission
support requests, and real-time lightning detection data. In addition,
the CDE included a real-time display from the
Ikhana’s
onboard video
tracking camera. A secure instant messaging client capability allowed
the NASA flight and science operations teams to remain in full
contact with partners distributed at various ICCs, EOCs
and other interested team members spread throughout
the world.
Project team members were embedded at various ICCs
and EOCs in southern California to assist the wildfire
management teams with the sensor data integration and
the implementation of the GoogleEarth CDE capabili-
ties during the week-long mission series.
Southern California UAV wildfire imaging missions
NASA responded to a request on 22 October 2007 from
the National Incident Fire Center-National Incident
Command Center (NIFC-NICC), the California
Governor’s Office of Emergency Services (CA-OES) and
the Federal Emergency Management Agency (FEMA)
to support the southern California wildfire teams with
critical airborne and satellite data resources, particu-
larly the data from the AMS-Wildfire instrument, flown
on the NASA
Ikhana
. The AMS-Wildfire instrument
and
Ikhana
had previously flown four wildfire obser-
vation missions during the summer of 2007, and was
ready to support the southern California conflagra-
tions.
On 24 October 2007, at 9:00 a.m. local time, the
Ikhana
took off from NASA-Dryden Flight Research
Center at Edwards Air Force Base near Palmdale,
California for a mission over the 11 major wildfires
burning in the southern California vicinity. Over a five-
day period, the aircraft flew four missions, relaying
real-time fire information to the ICCs and EOCs. Each
mission extended for seven to ten hours, with approxi-
mately 1,300 miles duration.
During the missions, the NASA team integrated real-
time hotspot detection data from the Terra and Aqua
satellite’s MODIS instrument into the CDE. The MODIS
data was collected two to four times daily at low-moder-
ate spatial resolutions. The data was used to develop
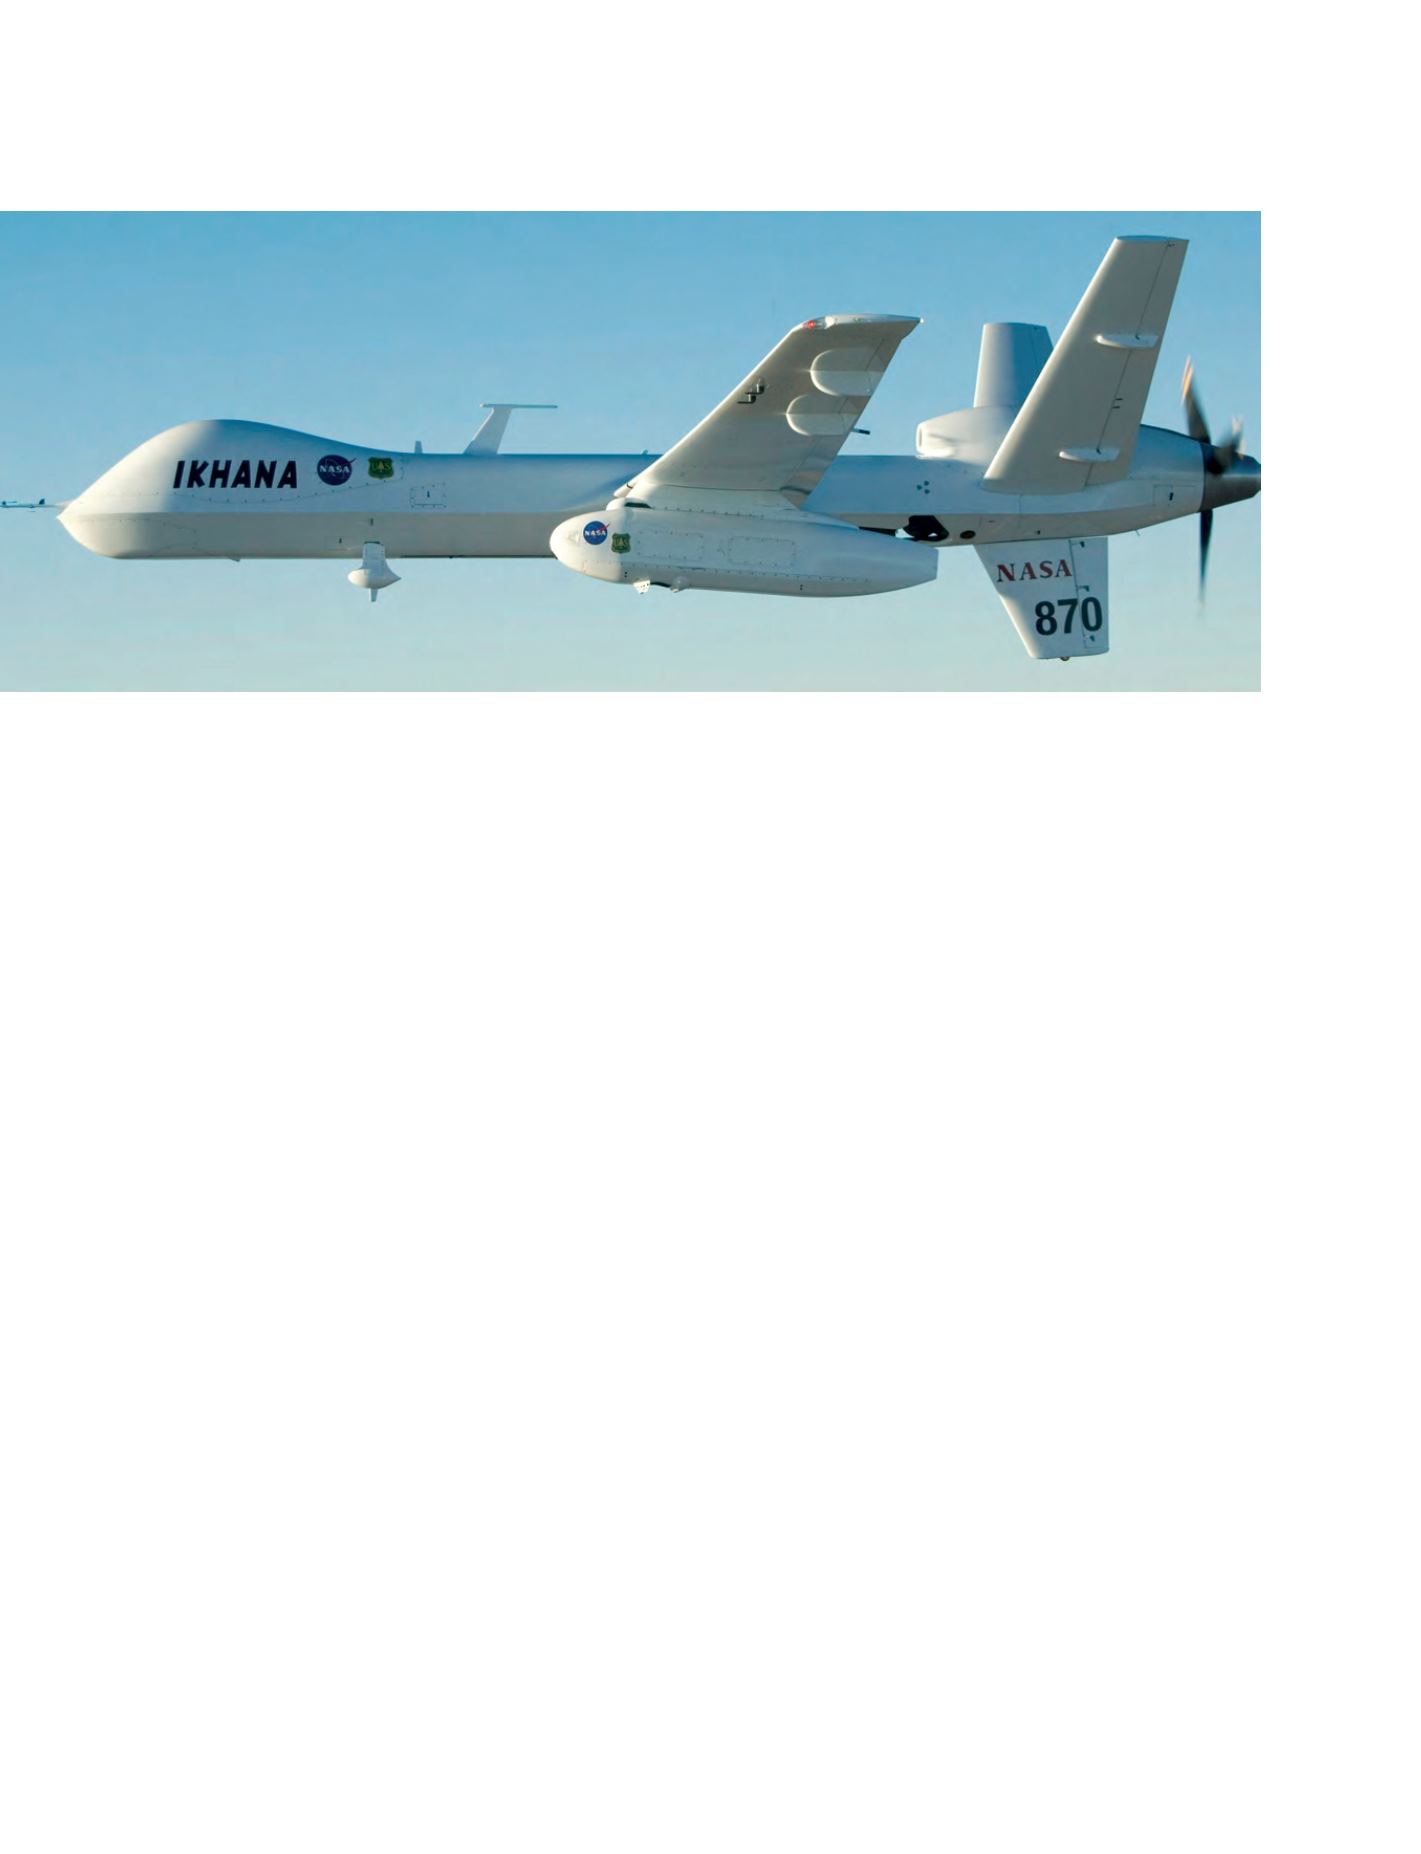
The NASA Ikhana UAV aircraft. The NASA AMS-Wildfire instrument is located in the instrument pod, attached to the inboard wing-mount location on the UAV
Image: NASA-Dryden flight research center