


 163 / 196

[
] 161
flight profiles for the
Ikhana
UAV in order to maximize mission acqui-
sitions over the most intense fire areas. The team prioritized mission
flight parameters based on a myriad of information, including
weather patterns, intense fire areas, fires affecting urban fringe areas,
busy air traffic areas/times, and other variables. Real-time collabo-
ration with ICCs and EOCs via the CDE instant messaging provision
also allowed their input to fire and mission priorities.
For each fire area, a mosaic of geo- and terrain-corrected image
scenes were collected and transmitted to a NASA server. The
GoogleEarth CDE allowed real-time access to that data at the NASA
server. When a fire area image was collected, a camera icon for that
location immediately appeared on the GoogleEarth CDE screen.
The icon could then be selected to display a snapshot thumbnail
image and pertinent collection information (location, time, file
name, etc). The full scene images can be ‘opened’ from the thumb-
nail and are immediately geo-positioned on the GoogleEarth terrain
background. The GoogleEarth tool allows 3D viewing of the terrain
and imagery, ‘fly-throughs’ and various perspective views. This
allows the ICC and EOC members to derive fire condition and
behavior in relation to the surrounding environment. Additionally,
the hotspot detection polygons were also autonomously processed
on the
Ikhana
and sent to the CDE through the same satellite
communications protocol.
The hotspot detection data layer provides hotspot polygons of the
fire front and also small hotspot locations that may otherwise go
undetected. Combined, these two data sets, derived from the AMS-
Wildfire sensor on the
Ikhana
UAV platform, provided critical,
real-time fire location information to the ICCs and
EOCs. Over the five days of mission operations, all the
sensor data was available through the CDE, allowing for
the creation of fire progression maps.
On 28 October, the final southern California wild-
fire UAV imaging mission was flown. At that time, the
fires were coming under control and some were in
‘mop-up’ condition. On that date, the NASA team
switched the AMS-Wildfire sensor acquisition mode in
mid-flight to collect post-fire burn area assessment
spectral band imagery. This data was provided in real-
time to the southern California ICCs and EOCs, to
begin initial post-fire vegetation rehabilitation assess-
ment activities. During the four missions, the
Ikhana
and AMS-Wildfire sensor logged over 32 hours of oper-
ation.
Overall impact of the UAV-sensor-acquired data
The ICCs and EOCs readily adapted the data provided
through the CDE and easily assimilated the information,
processing and visualization tools into their operational
environment during the southern California wildfires.
During the five days and four missions of the effort, over
150 daily users of the CDE were registered. Of the 400
image files collected (as well as the fire hotspot detection
vector file data) during the missions (one hundred
images per mission day), the community downloaded
40,000 file sets.
The capabilities demonstrated during the southern
California wildfires are currently being adopted by the
various wildfire management agencies at both the state
and federal level. NASA will continue to engage the
disaster community in developing, demonstrating,
evaluating and implementing new strategies and capa-
bilities to support disaster management and facilitate
a reduction in disaster losses. The rapid acquisition of
essential disaster data, delivered in near- real time, will
ultimately improve the capabilities of agencies to
combat and recover from disaster events. In many
instances, the disaster manager is ‘lost in the fog of war’
when faced with the blinding realization of a large
event occurring, where he/she has no ‘intelligence’
about the condition of the disaster event. The tools,
science and capabilities demonstrated under emer-
gency conditions during the southern California
wildfires will prove beneficial to disaster management
agencies and personnel worldwide and will lead to an
effective reduction in disaster losses. NASA looks
forward to its role in bringing space-age capabilities to
fruition to support the disaster-prone communities of
the United States and the world.
This activity helps support the Subcommittee on
Disaster Reduction Grand Challenges for Wildfire –
specifically, Grand Challenge number one in the
Implementation Plans that states: “Provide hazard and
disaster information where and when it is needed”.
NASA continues to support the Grand Challenge goals.
More information on the Grand Challenges can be found
at the subcommittee’s website.
1
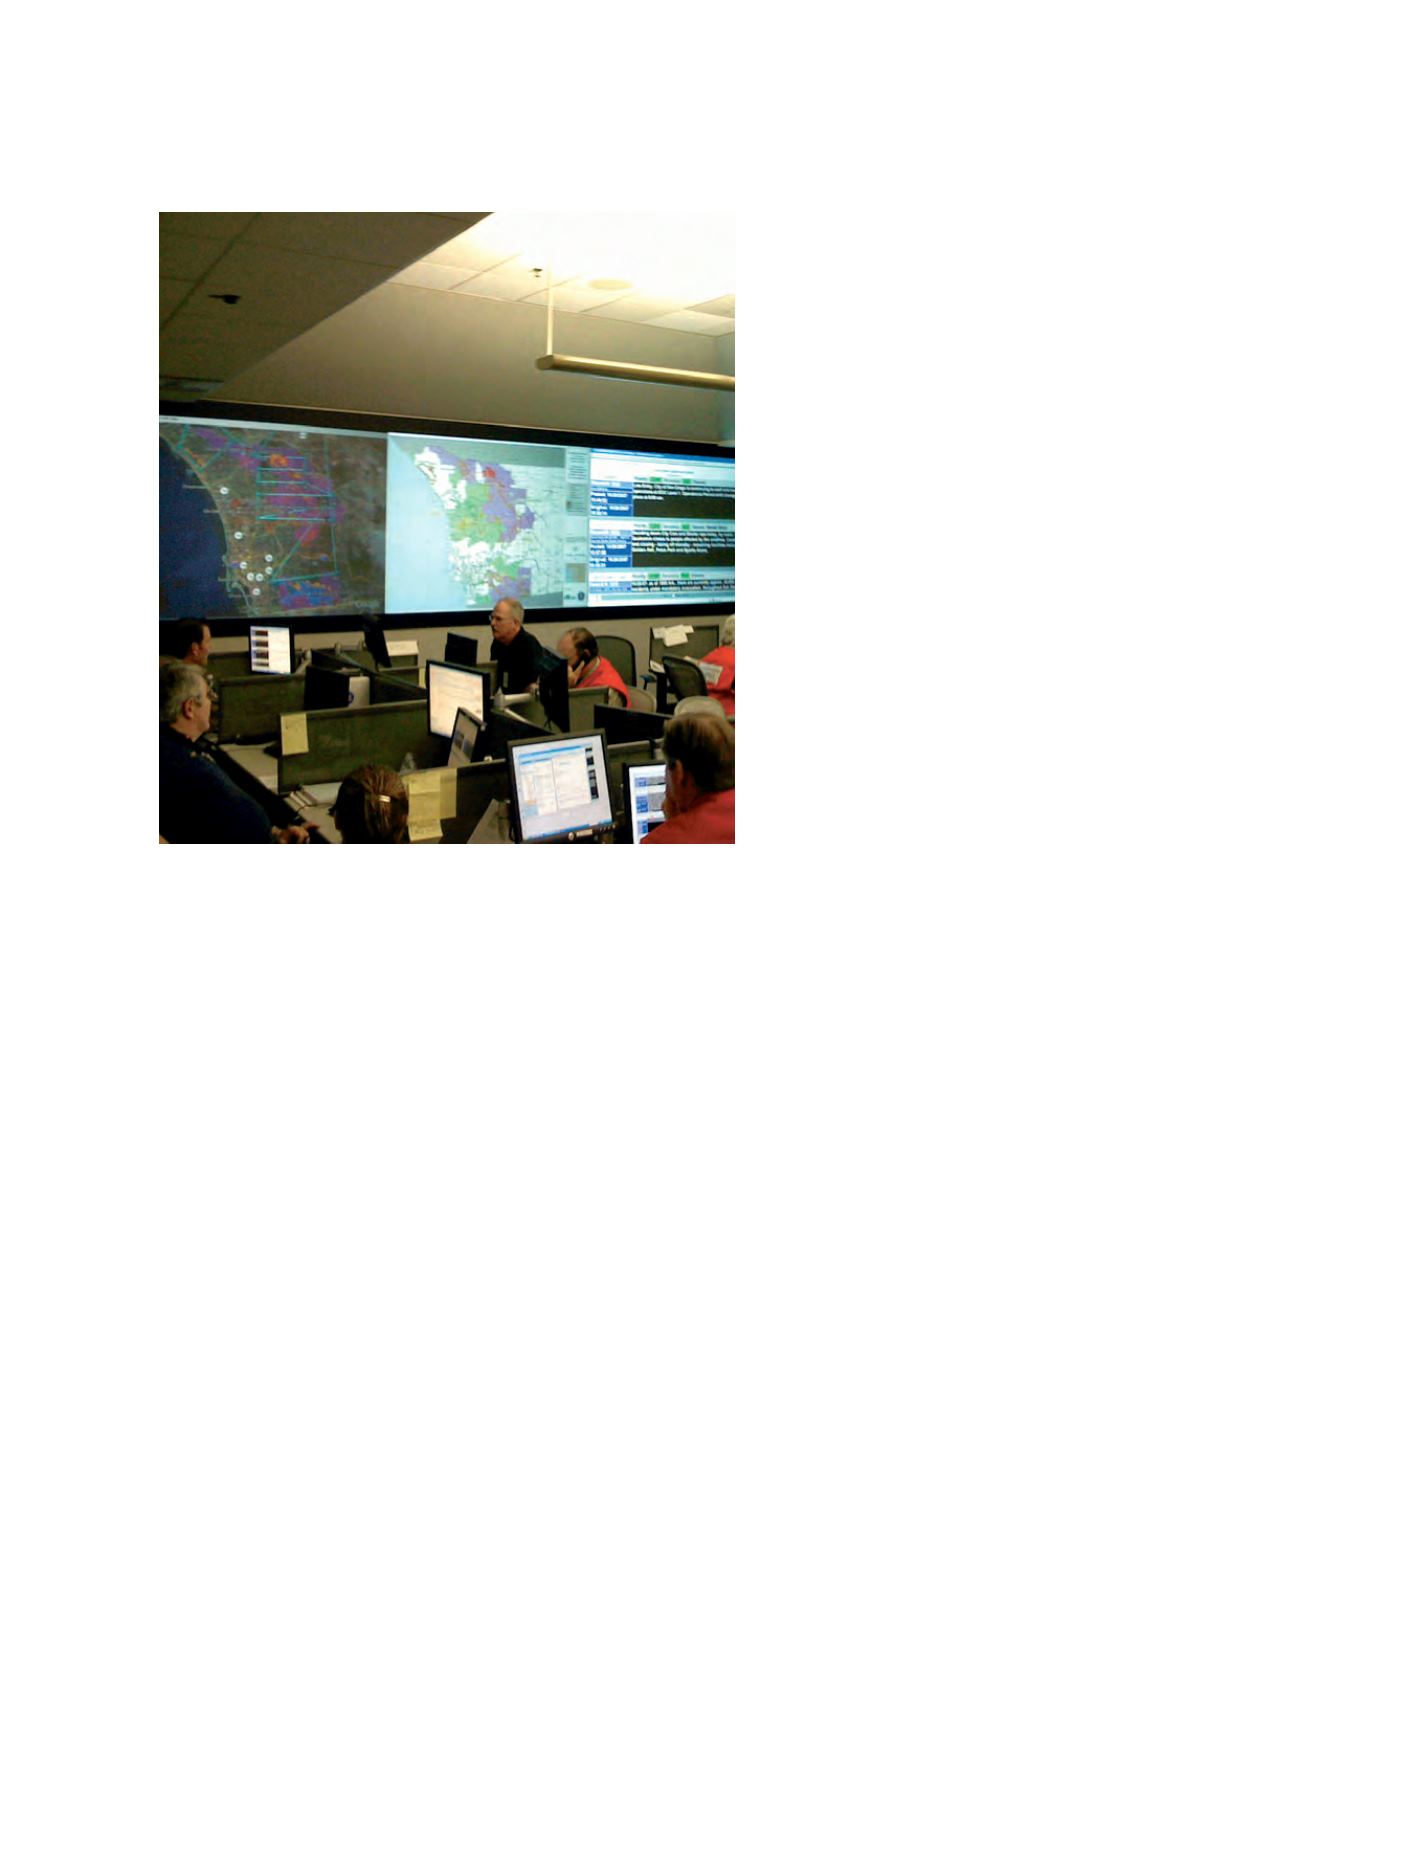
San Diego County Emergency Operations Center (EOC) during the southern California
wildfires, 25 October 2007. Note the large display on the left highlighting the
Collaborative Decision Environment (CDE) with the pertinent fire imagery datasets
visible on the GoogleEarth freeware display. The ICCs and EOCs used the NASA-
derived technologies to improve their disaster management capabilities
Image: J. Mendelsohn - Google