


 169 / 196

[
] 167
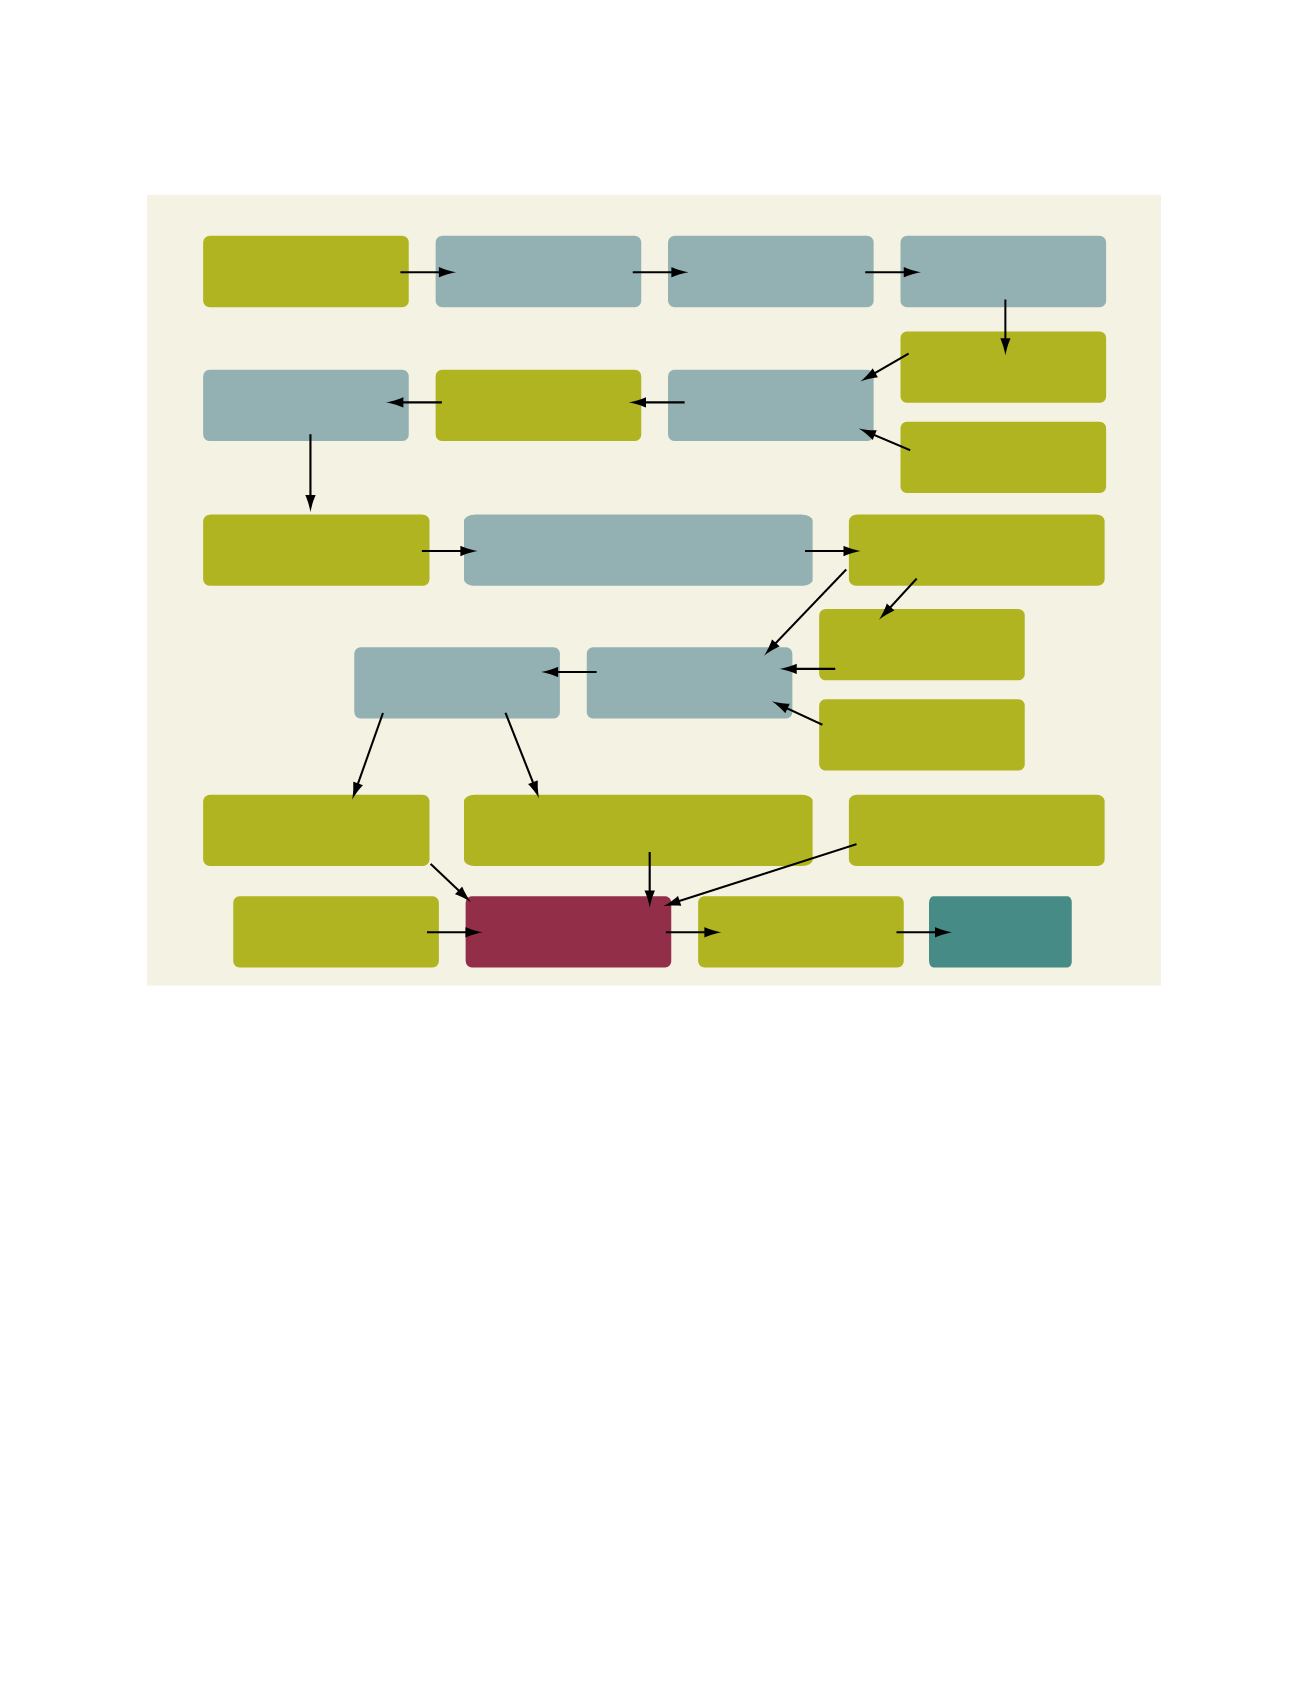
Satellite Images
Geo-rectification
Interpretation
Add Date Field
Truly Flooded Areas
(Provided daily to end-users)
Subtraction
Flooded Polygons with
Date of Flooding
GIS Analysis with AML
(GISTDA’s Intellectual Property)
Flooded Polygons with
Total Days of Flooding
Flood Damage Data
of each Administrative Region
Flood Damage Data of each Land Use Type
Reports, manuals, software
Vectorization
Polygons of water area
Water Bodies
Classify levels of flooding
Overlaying
Administrative Layer
Land Use Types
Relevant & Useful Data
e-Flood Map DVDs
Distribution
USERS
A step-by-step summary of the procedures followed during e-Flood Map production
Source: GISTDA
The levels of flooding classified by inundation periods
of 1-15 days, 16-30 days and more than 30 days were
found to be 1,553,309.60, 486,649.44 and 618,470.56
hectares respectively.
The e-Flood Map DVD-ROMs were produced and
distributed to end users in local governments and policy
makers in ministerial and departmental organizations.
The e-Flood Map received high acceptance.
The results of flood damage assessment from the e-
Flood Map project were reasonably accurate. The
analyzed information representing levels of flooding
could be used as a tool for decision-makers in compen-
sation evaluation. The e-Flood Map DVDs were
produced and completed in a short time, enabling the
end users in local governments to use them for flood
risk management.
The project was completed with cooperation from
several partners, and the developed procedures can be
applied to handle flood events in the coming years. The
well-structured aggregated spatial data can be used as a
historical database which will be invaluable for long-
term climate change study.
GISTDA to create a comprehensive database for the purpose of
long-term risk assessment and relief management.
Methodology of e-Flood Map creation
The tools used for creating the e-Flood Map were multi-date satellite
data, relevant GIS data, analysis software and distributed software. The
satellite data comprised microwave (SAR) data from RADARSAT and
ALOS satellites, with optical data from LANDSAT-5, and SPOT 2, 4 and
5 satellites. More than 80 scenes of satellite data were acquired and used.
GIS data included administrative boundaries from the Ministry of
the Interior; land use data from the Ministry of Agriculture and
Cooperatives; land parcel data from the Department of Public Work
and Town/Country Planning, and a topographic map from the Royal
Thai Survey Department.
Image analysis and GIS software, with ArcGIS Publisher Extension,
were used for data analysis and preparation, and a Visual Basic appli-
cation, ArcReader (freeware), GIS data, satellite images, and
summarized reports were distributed.
Results and achievements
The total inundated area in Thailand in 2006, as analyzed from
various satellite images, was 2,658,429.28 hectares.