


 167 / 196

[
] 165
a chain of physical processes of ionization of air molecules. This
primary sequence leads to two major consequences: change of the air
conductivity and, consequently, change in the near ground atmos-
pheric electric field, which includes latent heat release. A second
phenomenon, known as the ‘thermal branch’, has been established by
the scientific community only recently with the increase in measure-
ments of surface temperature in different bands of infrared emissions
detected by NASA and NOAA satellites.
8
One of the important components of utilizing thermal remote-
sensing data (NASA’s Terra and Aqua, NOAA’s GOES and POES) is
analysis of the continuous outgoing long wave earth radiation (OLR),
which indicates anomalous variations prior to a number of medium
to large earthquakes.
9
OLR energy has been measured at the top of
the atmosphere by NASA and NOAA satellites and includes emis-
sions from the ground, atmosphere and cloud formation. We have
been using NOAA/AVHRR IR daily and monthly (two and half
degree) gridded data to differentiate between global and seasonal
variability and the transient local anomalies.
This phenomenon has been linked theoretically as part of a rela-
tionship between tectonic stresses, electrochemical and
thermodynamic processes in the atmosphere and increasing Earth
radiation emission, all part of a family of EM phenomena related to
earthquake activity. The timescale of the observed variations is a few
days, seen a week or more before the onset of the seismic event. In
comparison with several years of data, the observed time series
preceding the earthquake had unusually high OLR. The OLR anomaly
corresponds to a large area of ground coverage and coincides with
the main epicentral zone. We explored the significance of these obser-
vations for the two most devastating events on the Asian continent,
the M7.6 Kashmir earthquake of 8 October 2005, and most recently
the Mw 7.8 earthquake in Eastern Sichuan, China on 12 May 2008.
In the case of the Kashmir earthquake, compared to the reference
fields for the months of December 2005, 2006 and 2007, we found
OLR anomalous fluxes of the order of >32 W/m
2
, with an absolute
value of 282 W/m
2
along the epicentral area beginning 4 October,
four days before the event. Maps of daily night-time thermal infrared
(TIR) anomalous (mean field defined for three years 2005-2007) of
Earth outgoing radiation (NOAA18/AVHRR, 1:38 a.m. mean local
time) over Kashmir/Pakistan region for 5-8 October are
presented below. Tectonic plate boundaries are shown
with a red line, with major faults in brown. Red stars are
earthquake epicentres, red circles – 0.5 pixel area. A
monthly time-series graph for the daily night-time OLR
variations – for 25 September-25 October 2008 over the
pixel nearest to the epicentre (35N/72.5E) area – reveals
some pre-event (in red) and post-event aftershock activ-
ities (in green).
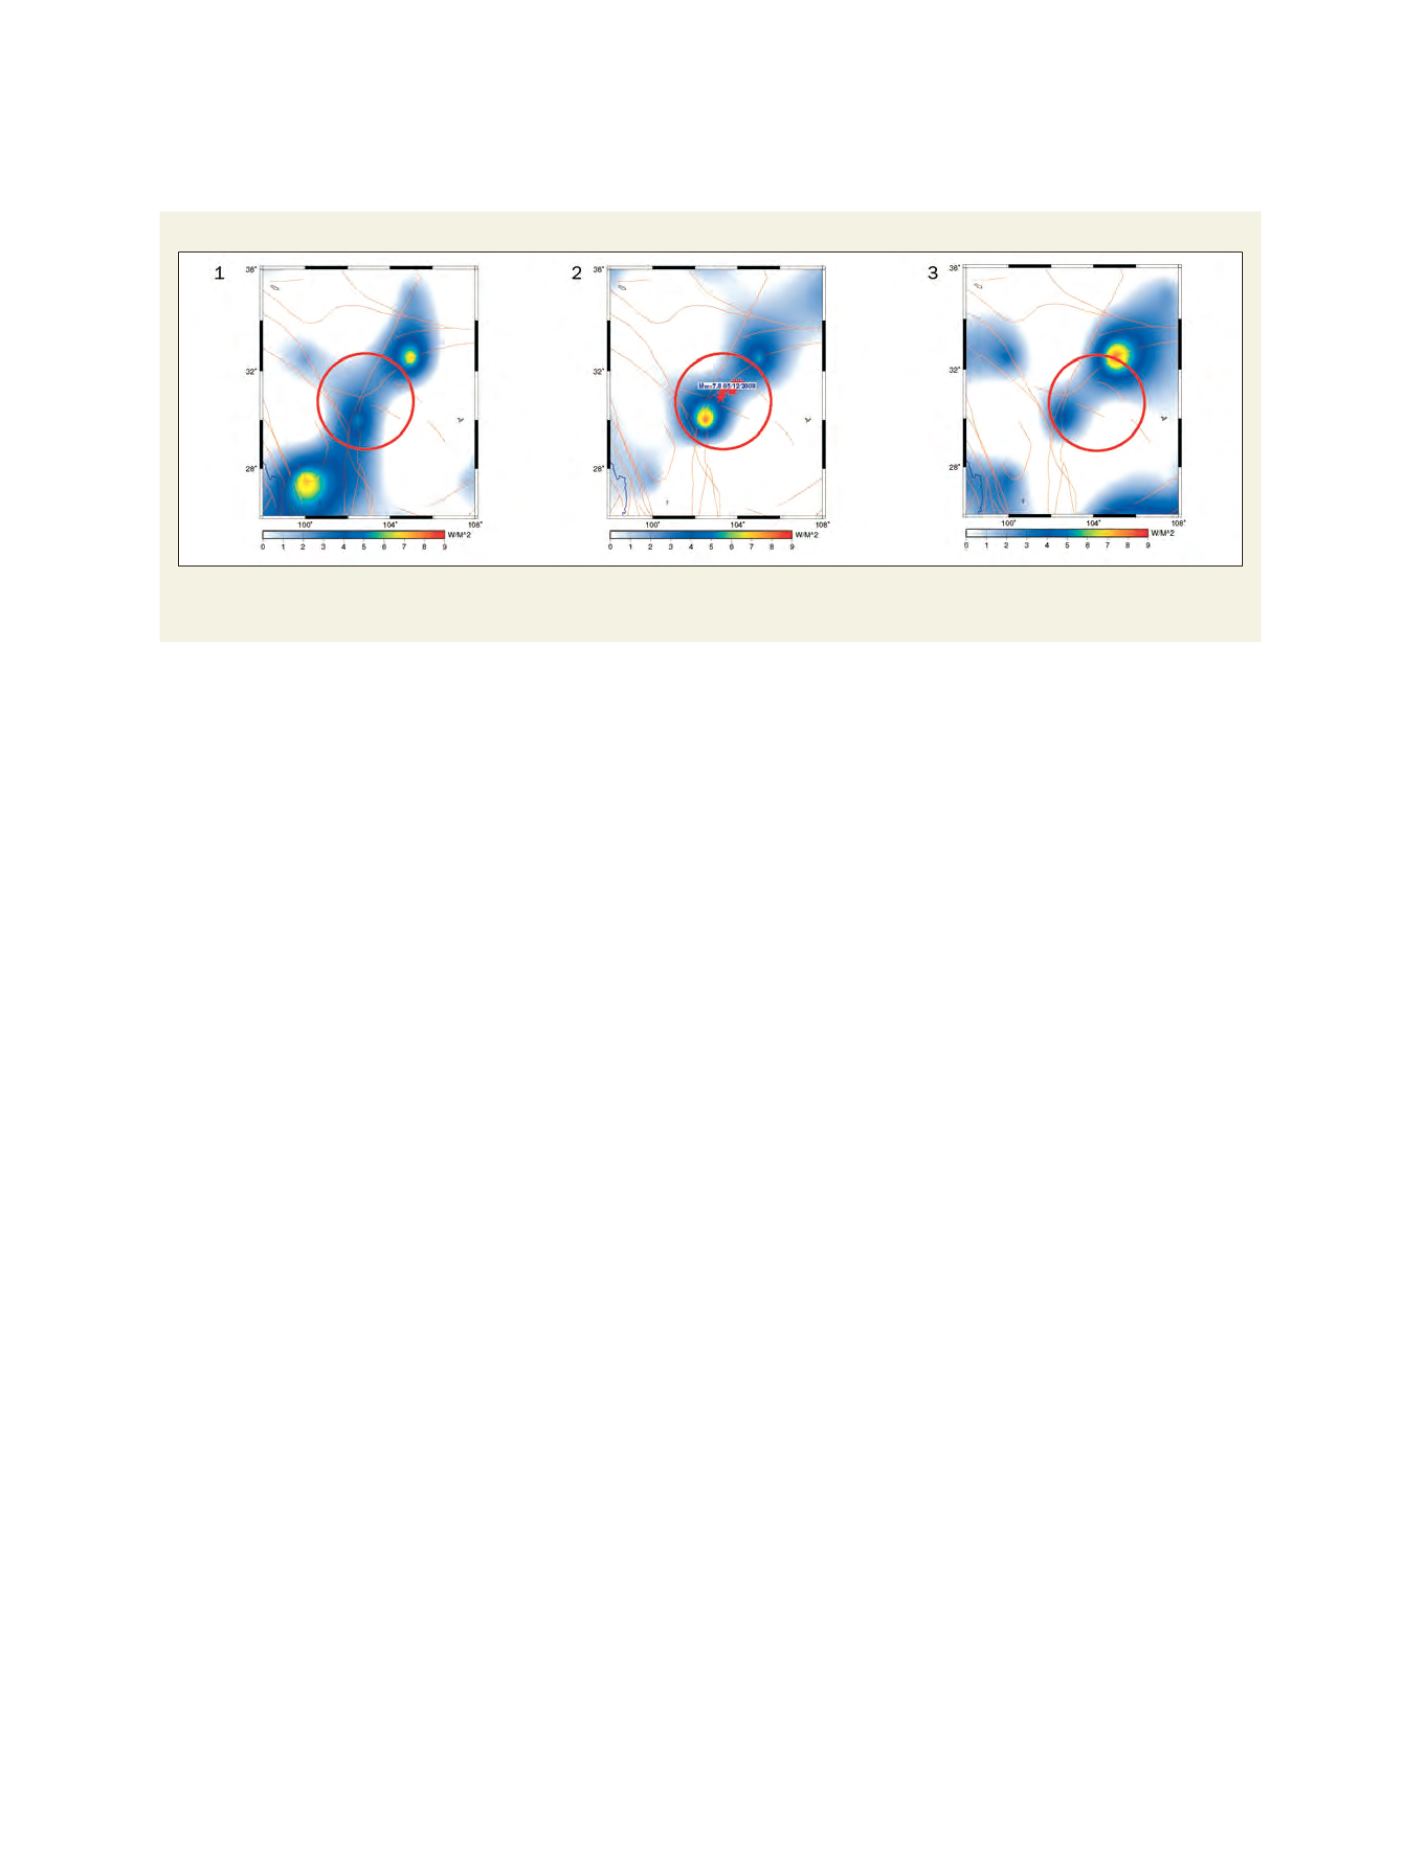
In the case of the Eastern Sichuan earthquake, the
NOAA-18 OLR survey for April-May shows that the
initial indication of building an atmospheric anomaly
was detected on 5 May (five to six days before the main
shock) and the maximum reaches the value of 20 W/m
2
westward from the epicentre. The OLR reference field
was built for the entire period of 2005-2007. During the
period of 6-9 May, strong OLR anomalies were building
near to the epicentral area, over the major fault lines
with the highest value of 38 W/m
2
. These are most likely
connected with the gas release enhancement and addi-
tional flux emission, and provide information about
major fault activation in this area.
In summary, through our research we have found a
significant relationship between solid Earth actions and
atmospheric and ionospheric coupling. This relationship
has been studied by a number of scientists with impor-
tant results, but more work in this area needs to be done.
It is not a trivial effort and will require many more years
of research before such an application should become
important for earthquake prediction. NASA’s role in this
research is clear in that the agency has a history of explo-
ration into the unknown. We hope that this work will
eventually provide significant early warning for such
catastrophic events as the recent earthquake in China. It
is with this in mind that NASA will continue to support
this and other methods of monitoring and early detec-
tion of Earth movement, such as GPS and InSAR, to
provide societal benefit to the nation and the world.
Monthly maps of OLR around the time of M7.8 Sichuan earthquake of 12 May, 2008
(1) a month before (1-30 April), (2) during (1-31 May) and (3) after (1-30 June) the M7.8 12 May, 2008 earthquake (reference field for 1980-2008),
(tectonic plate boundaries with red line, and major faults with brown color, red stars – earthquake epicentres, red circle – 0.5 pixel area)
Source: Ouzounov D., S.Pulinets, M.Parrot, P.Taylor, S.Habib, H.C. Wu, J. Ma, C.I-Wan Atmospheric and ionospheric signals associated with the Eastern Sichuan, China M7.8
earthquake of 12 May 2008 revealed by multi sensor space and ground observations, 2008, (in preparation)