


 190 / 196

[
] 188
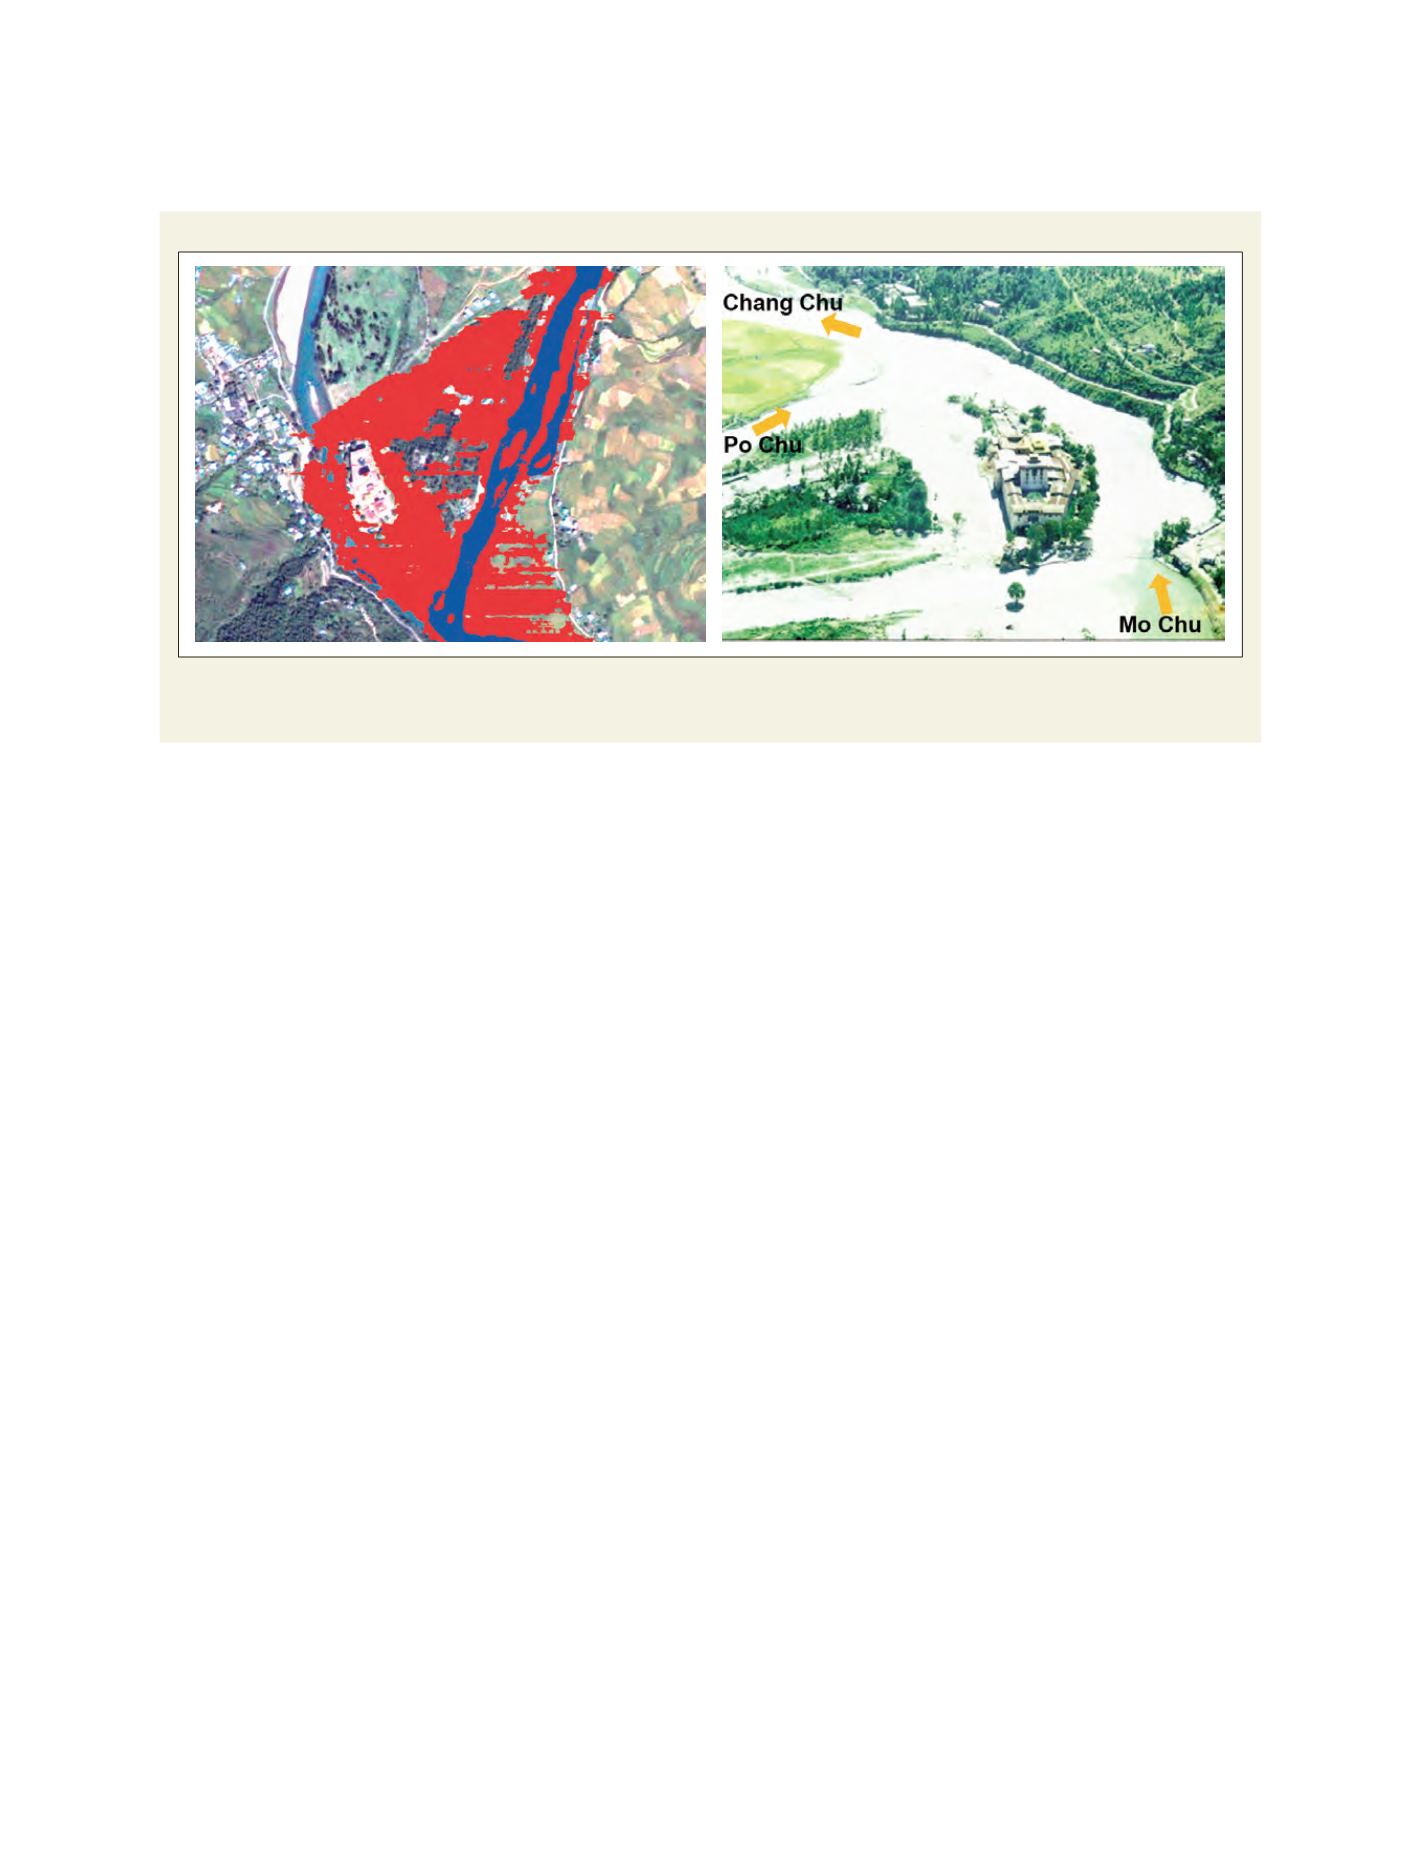
tion of Dzong is a castle and governmental office. Our
analysis results almost perfectly coincided with the
actual photo. The northern part of Punakha Dzong was
an old riverbed and low topographic area. DSM by
PRISM data can clearly detect this area.
It is difficult to perceive this low topographic area
from the pan-sharpened image of ALOS data on the left-
hand side image of the enclosed figure, because this area
is already covered with vegetation and it is impossible to
interpret riverbed features. The right-hand side image
is an OPS sensor image from the JERS-1 satellite
observed on 6 February 1995, and it was able to inter-
pret the white-coloured river bed spreading to the
northern side of Punakha Dzong due to sand sedimen-
tation from the Po Chu River caused by the GLOF event.
Activities for the latest great earthquake in the
northern part of Japan
On 14 June 2008, an earthquake of magnitude 7.2
occurred in the northern part of Japan. This earthquake
was named the ‘Iwate-Miyagi Nairiku Earthquake of 2008’.
Several people were killed. Furthermore, huge numbers
of landslides occurred in the mountainous area. The land-
slide near the Aratozawa Dam is the largest class of
landslide caused by seismic wave in the history of Japan.
The enclosed figure shows this landslide captured by
ALOS PRISM which is a medium resolution (2.5 metre
spatial resolution) optical sensor. In the figure there are
two images showing pre and post-disaster. From the
figure, landslide mass is estimated at an area of approx-
imately 1,400 metres by 800 metres. PRISM observed
the Earth’s surface using between one and three optics.
Therefore, we can analyse the topography from stereo
and/or triplet data. If we use the data of pre- and post-
earthquake, we can obtain the mass of the landslide, and
facsimile, and the estimated water level through the short message
service (SMS) of a cell phone. The information passed from Japan to
collaborators in Vietnam, and the practical test was successful.
Feasibility study of GLOF using ALOS data
Recent global environmental change might have a relationship with
the retreat and melting of alpine glaciers. The Himalaya is the highest
mountainous region in the world and there are many glaciers and
glacial lakes. In recent years, many studies have reported the retreat
of these glaciers and the expansion of glacial lakes. Several disasters
have happened due to flooding by melt water from glacial lakes,
termed a Glacier Lake Outburst Flood (GLOF). Therefore, it is neces-
sary to investigate the potential danger of each glacial lake for the
prediction and mitigation of GLOF. Satellite data is one of the promis-
ing methods of solving the above problem.
Bhutan is a small Tantric Buddhist country at the southeastern
side of the Himalaya. Its population is around 600,000 and almost
all people live in a natural Himalayan environment. The Po Chu
River has its source in the Himalayan mountains and flows down to
Punakha and Wangdue Phodrang, an ancient and honourable city
in Bhutan. In 1994, a serious GLOF event hit this river basin and 21
human lives were lost.
We introduce here the application of ALOS data for the estima-
tion of a GLOF flooded area, using a PRISM Digital Surface Model
(DSM) generated from a triplet image. It is known from our field
survey results that the flooding height caused by the 1994 GLOF
reached approximately 1.8 metres above the river surface at Chang
Chu River basin. We simulated the GLOF damaged area using PRISM
DSM and evaluated the result in comparison with photos acquired
at that time. The analysis method is to first extract river water by
supervised classification. Then, the area with a topography two
metres higher than the river water surface on DSM was considered
a damaged area by GLOF and was masked.
An enclosed figure shows the result of this analysis and actual
photos taken just after the GLOF around Punakha Dzong. The func-
Estimated GLOF damaged area
Left: The simulated GLOF area. Red painted area shows the simulated GLOF damaged area using ALOS/PRISM DSM data; Right: The actual photo of the
damaged area acquired on 10 October 1994
Source: Remote Sensing Technology Center of Japan; Photo: Phuntso Norbu