


 227 / 280

[
] 227
Applications of reanalysis
The success of reanalysis as a tool for global climate monitoring can be
measured by the number, variety and quality of applications of its prod-
ucts. There are few spheres of life that are not touched by weather and
climate. Reanalyses have accordingly found application in sectors such
as agriculture, water, air quality, health, ecosystems and biodiversity. Direct
applications in the field of weather and climate include studies of
predictability fromdays to seasons ahead, estimation of long-range trans-
port of pollutants, investigation of recent climate change and assessment
of the capability of climate-prediction models to simulate such change.
As reanalysis systems are further refined, their products will increasingly
form the backbone of the quantitative information essential for climate
related policy- and decision-making in a changing global environment.
Reanalysis and climate studies
Climate, defined from the long-termstatistics of the atmosphere, is demon-
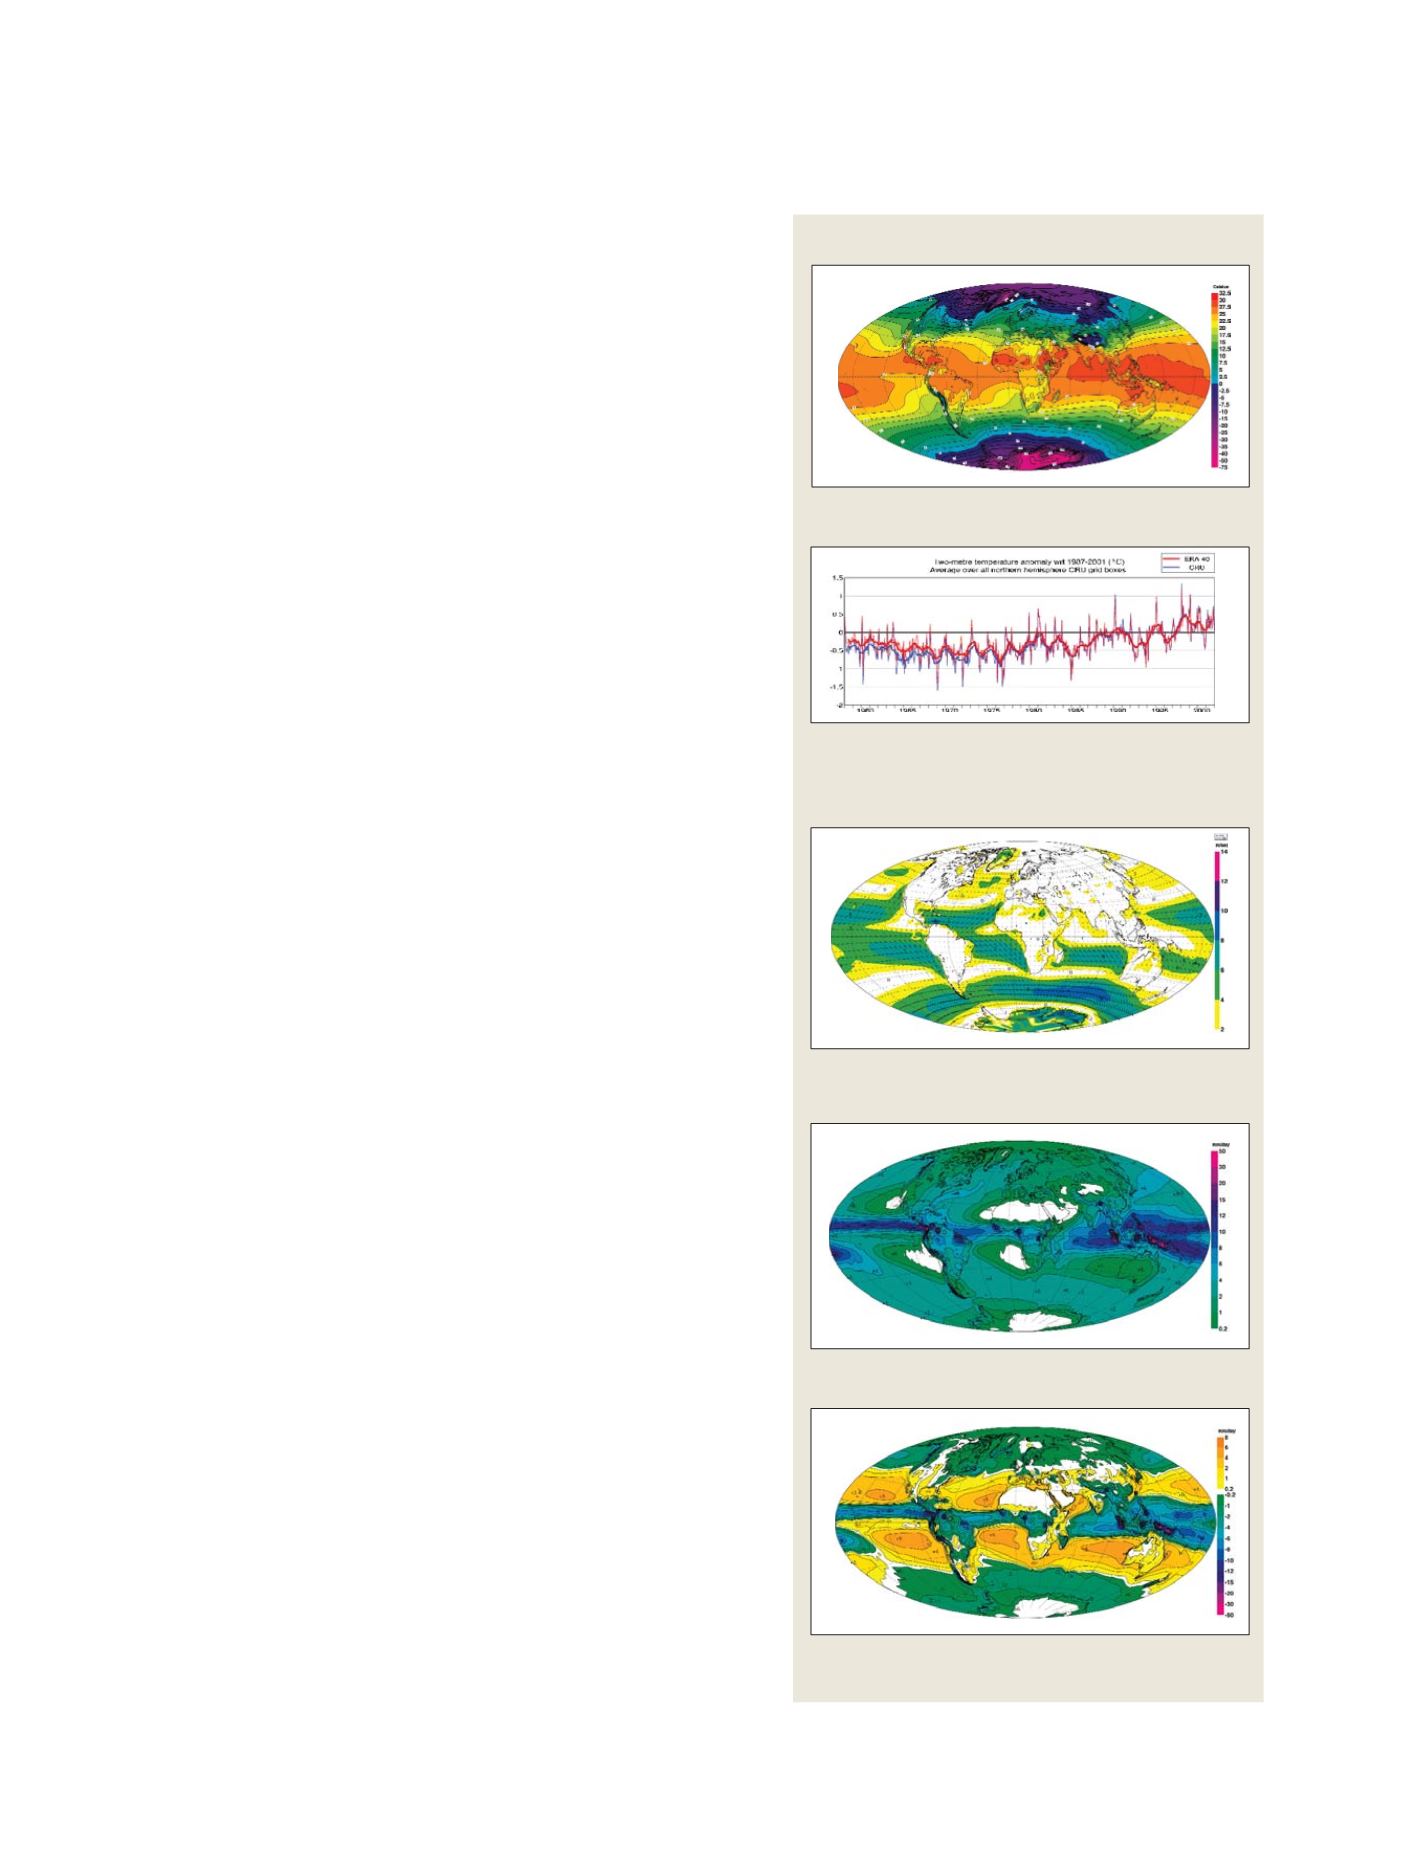
strated here with a few examples. A basic climate quantity is the annual
mean near-surface (two-metre, or screen-level) temperature. The first
image shows this from ERA-40, averaged from 1979 to 2001, the period
with the best and most time-consistent product quality for the globe as a
whole. The spatial structure over the oceans follows the warm and cold
ocean currents near the continents. The warming effect of the Gulf Stream
is seen throughout Europe and extreme cold temperatures are found over
the high Antarctic plateau.
The graph compares a time-series of monthly means of the ERA-40
reanalyses with the climatological temperature analyses of monthly-mean
station data by the Climate Research Unit (CRU) of the University of East
Anglia, averaged over the land areas of the Northern Hemisphere. The
ERA-40 temperature trend agrees very well with the CRU data from the
late 1970s onwards, indicating that the quality of the reanalysis temper-
atures is good. Earlier, however, the ERA-40 temperatures indicate
systematically too warm temperatures, the main reason being that not all
observations that went into the monthly-means used in the CRU analy-
sis were readily available as instantaneous values for use in ERA-40.
Recovery of such data from national archives and other sources remains
an important task, not only for the improvement of future reanalyses but
also for direct use of the data in study of climate extremes.
The second global image shows the mean surface wind patterns (mean
vector wind and speed). This type of plot picks out where winds blow
persistently throughout the year from a prevailing direction, showing the
trade winds over the tropical oceans and westerlies around southern lati-
tudes peaking in the ‘roaring forties’ over the Southern Indian Ocean.
Regions where wind direction is more variable on both synoptic and
seasonal time scales are de-emphasized, so the storm tracks of the North
Atlantic and Pacific Oceans show only weakly. The meanwinds and their
fluctuations are the driving forces of the ocean circulation, and reanalysis
products have important applications in ocean simulation studies and in
the development of seasonal forecasting systems.
Annual-mean precipitation, shown in the third image, is not determined
directly from observations but is instead a product derived from averag-
ing short-range model forecasts. Its quality is related both to the quality
of the dynamical and physical processes of the forecast model and to the
quality of the reanalysis of water vapour, temperature and wind used to
initiate the forecast. It can be seen that most of the global precipitation is
produced in the equatorial convergence zones. The patterns of precipita-
tion are in good agreement with independent precipitation analyses. Mean
values are too high over the tropical oceans in ERA-40, but interannual
variations are found to be realistic, capturing the major shifts associated
with El Niño events, for example.
Global climate monitoring
Global mean two-metre temperature 1979–2001
The temperature trends represented by anomalies from the 1987
–2001 mean for the ERA-40 reanalysis and for the CRU analysis.
Monthly means and 12-months running means are shown
Annual daily mean precipitation (mm/day) 1979–2002
Annual mean evaporation-minus-precipitation (mm/day)
1979–2002
Mean annual near surface wind speed (m/s) and direction
1979–2001
Evaporation – precipitation
Annual mean
Screen level temperature
Annual mean
Total precipitation
Annual mean
10 metre wind
Annual mean
S
OCIETAL
B
ENEFIT
A
REAS
– W
EATHER