


 228 / 280

[
] 228
When the amount of precipitation is subtracted from the
amount of evaporation, areas of net evaporation and net
precipitation can be seen. Energy exchanged between the
atmosphere and the surface is an important component of
what is needed to understand how the Earth’s climate system
works, how the climate is changing and for what reason.
Comprehensive direct global measurements of such quan-
tities do not exist, and a key challenge for future reanalyses
is to provide improved estimates in support of studies of
climate change, its prediction and its implications.
Web and print versions of an ERA-40 Atlas have been
published by ECMWF. The Atlas describes the atmospheric
climate for 1979–2001. The climate is presented in maps
for the four seasons, the annual average and the inter-annual
variability. A selection of time series, showing the quasi-bien-
nial oscillation of stratospheric winds, is presented for the
full period 1958–2001. A complementary atlas of the ocean-
wave climate has been produced by the Royal Netherlands
Meteorological Institute, a partner in the ERA-40 project.
Outlook
An ECMWF ‘interim reanalysis’ is currently being produced
using a more advanced (four-dimensional variational) data
assimilation system and higher horizontal resolution than
ERA-40. It covers the period from 1989 onwards and
addresses several of the deficiencies (such as high tropical
oceanic precipitation) identified in products from the later
years of ERA-40. Production of ERA-Interimbegan in 2006
and will reach the present day in 2008, after which it will be
updated on a near-real-time basis. ECMWF is also develop-
ing plans for a new project, called ERA-75, to cover the
period from 1938 to the present using an even more recent
version of the reanalysis system, including provision to cope
better with the poorer data coverage of the pre-satellite years
and poorer quality of early satellite data. The project may
start in 2009, subject to establishing the appropriate funding
scheme and collaboration partnerships. When the new
reanalysis reaches the present day, it may in turn be contin-
ued in near real time, and supersede ERA-Interim.
Key to this effort will be coordinated international efforts
under the Global Climate Observing System (GCOS), the
World Climate Research Program (WCRP) and the wider
GEO umbrella to recover and combine historical observa-
tional data from a wide variety of sources, to manage these
data to modern standards, and to incorporate metadata on
the quality of these data, including that derived from any
use of the data in earlier reanalyses. Continued collabora-
tion among reanalysis centres to exchange experience and
ensure complementary and shared research and develop-
ment programmes is equally vital to ensure that progress is
made in the most effective way, and that the needs of a large
and widening user community are met as fully as possible.
Open access to the products of reanalysis enables users
worldwide to benefit froma specialized and highly advanced
central processing of observations that have been gathered
throughout the world, and easier future access to more
comprehensive and higher-resolution product sets will be
essential if reanalysis is to realise its potential as a key compo-
nent of the Global Earth Observation System of Systems.
Weather analysis, an optimal combination
of observations and model
In a weather analysis each weather element in the free atmosphere is
described in three dimensions. Observations are used to adjust optimally
the representation of elements within an atmospheric forecast model, at
grid points that cover the globe in the horizontal and at a number of levels
disributed in the vertical from the surface to the top of the model
atmosphere. The density of spacing defines the resolution of the model and
of the weather analysis.
Better reanalysis products can be produced by improving the model, the
observations and/or the weather analysis algorithm that uses the
observations to adjust forecast model values. Reanalysis is thus an
iterative process. A new reanalysis can extract new and more accurate
information from observations relating to the Earth’s climate than a
previous reanalysis
ERA-15 1979-1993 125km 31
32km 1995
Resolution
Horizontal
Vertical
Number of
levels
Top level
The design
year of the
system
ERA-40 1957-2002 125km 60
65km 2001
Operations 2006-now 25km 91
81km 2005
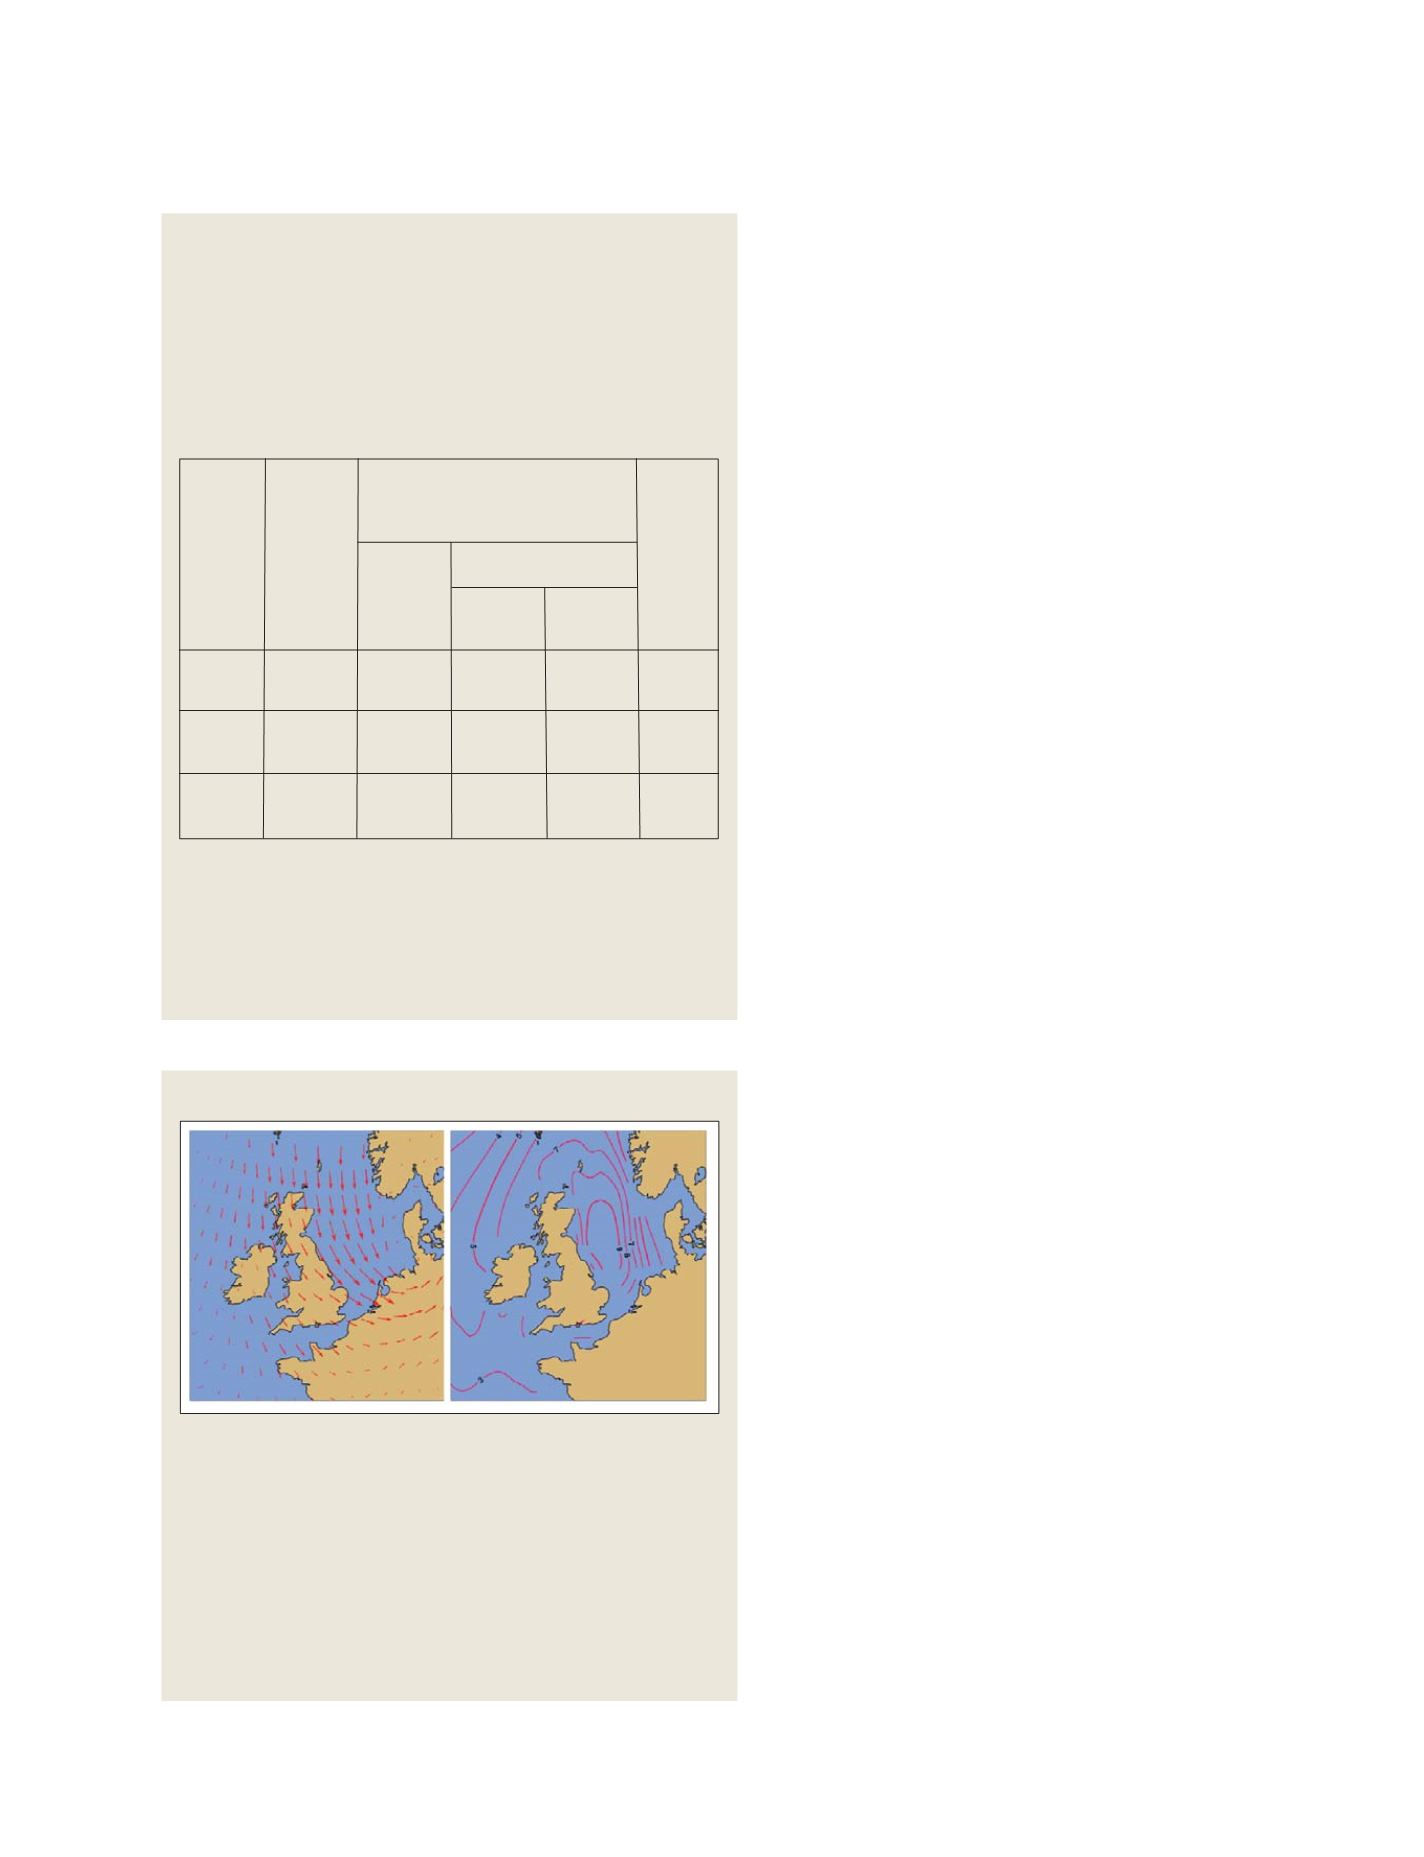
North Sea flood of 1953
Near-surface wind (maximum speed about 30ms-1) and ocean-wave height
(metres) from a reanalysis for 00UTC, 1 February 1953, the night of a
devastating North-Sea storm.
The strong winds from the north have a long fetch (the distance over which
wind blows without changing direction) to develop more than nine-metres
high waves over a large area.
The combination of high tide and the high waves had devastating effect. In
order to better understand the effects of the storm, the global reanalysed
fields have also been used as boundary conditions for high resolution limited
area atmospheric models, which in turn drive detailed storm surge models
S
OCIETAL
B
ENEFIT
A
REAS
– W
EATHER